This site uses cookies to improve your experience. To help us insure we adhere to various privacy regulations, please select your country/region of residence. If you do not select a country, we will assume you are from the United States. Select your Cookie Settings or view our Privacy Policy and Terms of Use.
Cookie Settings
Cookies and similar technologies are used on this website for proper function of the website, for tracking performance analytics and for marketing purposes. We and some of our third-party providers may use cookie data for various purposes. Please review the cookie settings below and choose your preference.
Used for the proper function of the website
Used for monitoring website traffic and interactions
Cookie Settings
Cookies and similar technologies are used on this website for proper function of the website, for tracking performance analytics and for marketing purposes. We and some of our third-party providers may use cookie data for various purposes. Please review the cookie settings below and choose your preference.
Strictly Necessary: Used for the proper function of the website
Performance/Analytics: Used for monitoring website traffic and interactions
In the world of analysis, at least one thing is true: if you like diagrams, you have probably come to be close with Unified Modeling Language (UML). UML Diagrams are helpful to show flows and relationships of information. The post Add some UMPH to your UML appeared first on Business Analyst Articles, Webinars, Templates, Jobs.
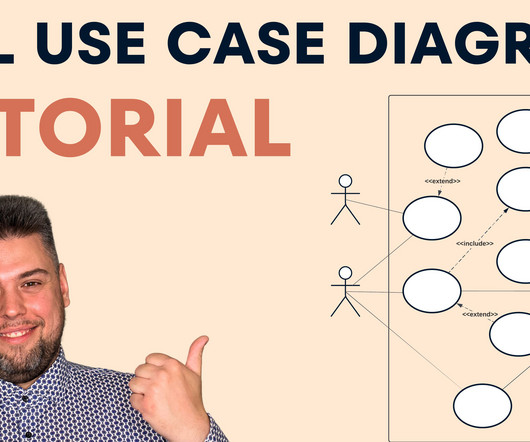
UML Use Case Diagrams Overview A UML Use Case Diagram is like a simple map that shows what a system or software does and who interacts with it. Critical Parts of the UML Use Case Diagram Actors : People, other systems, or devices interacting with your system. You will find my business analysis digest, my articles, and more!
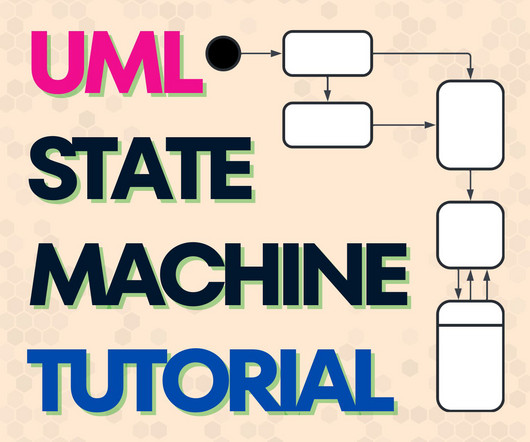
What is the UML State Diagram In software development, understanding how objects behave and change over time is essential to model system behavior. This is where the UML State Machine Diagram comes into play. Why Do We use UML State Machine Diagram for our projects? But why do we need them, and what makes them so valuable?
For a long time, there was a problem with creating UML diagrams with Chat GPT. In this step-by-step tutorial video, I will show you how to create Unified Modeling Language (UML) diagrams using OpenAI’s ChatGPT, Plant UML, or Mermaid syntax, and work with them in Miro/Diagrams.net (Draw.io). But recently I found a way!
Tools like flowcharts, process maps, UML diagrams, and wireframes enable business analysts to translate abstract concepts into concrete visuals. Similarly, UML diagrams or system models help technical teams understand functional requirements and system interactions.
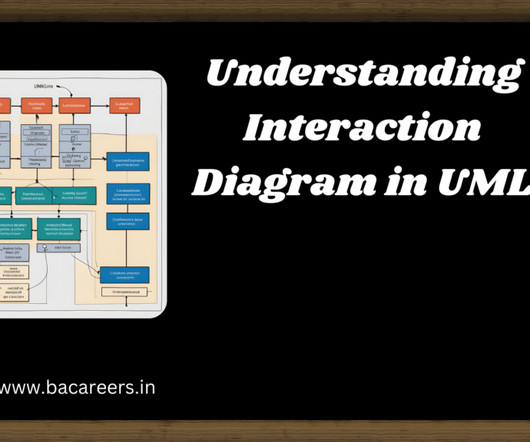
Interaction Diagram : Interaction diagrams are crucial tools in Unified Modeling Language (UML) that help visualize how objects in a system interact with each other. These diagrams are essential for designing and understanding complex systems, offering a clear view of the interactions between various components.
Warehouse management plays a pivotal role in the smooth functioning of supply chains, influencing everything from inventory control to… Continue reading on Analyst’s corner »
what is uml diagram ? UML (Unified Modeling Language) is a standard language that allows software developers to create diagrams that can be shared across different tools. UML (Unified Modeling Language) is a standard language that has been developed by Object Management Group (OMG). appeared first on BA Career.
Unified Modeling Language (UML) stands as the cornerstone of modern software development, offering a standardized approach to modeling systems. Among its diverse set of diagrams, UML interaction diagrams hold a special place, facilitating the visualization and understanding of dynamic interactions within a system.
UMLs Sequence Diagram is the most common way to describe interactions across several services. You can use different diagrams to describe a flow, such as a UML Activity or Flowchart. .", "status": "in_progress", "createdAt": "2025-01-19T10:15:00Z" } ] } How can we define the workflow for thatAPI?
You’ll work on real-world case studies and use UML diagrams. Our SQL Training for Business Analysts is a hands-on program that covers SQL basics, database management, query writing, data analysis, and report generation. Plus, you’ll receive a certificate upon completion to showcase your skills to employers.
what is uml diagram ? UML (Unified Modeling Language) is a standard language that allows software developers to create diagrams that can be shared across different tools. UML (Unified Modeling Language) is a standard language that has been developed by Object … Continue reading "What is uml Diagram ?"
UML Activity Diagram UML Activity Diagram is… The post BPMN Tools appeared first on BA Career. Business Process Modeling Notation (BPMN) The Business Process Model and Notation (BPMNs) standard was developed by Object Management Group (OMG). It is a graphical notation for describing business processes.
UML Activity Diagram UML Activity Diagram is… The post BPMN Tools appeared first on BA Career. Business Process Modeling Notation (BPMN) The Business Process Model and Notation (BPMNs) standard was developed by Object Management Group (OMG). It is a graphical notation for describing business processes.
Tutorial IV: Skills for Business Analyst Tutorial V: Understanding Software development process with a case study Tutorial VI: Software Development Life Cycle Methodologies (SDLC Basics) Tutorial VII: Business Analysis Techniques Tutorial VIII: What is UML Modelling? What is UML Modelling?
UML diagram. UML diagram. Here’s where UML comes in handy. UML stands for Unified Modeling Language, and it’s a modeling technique that helps you describe the elements that make up a specific software system and how such elements interact with each other. Data flow diagram. Gantt chart. And many more.
The Key aspects of this book are: These questions cover a wide range of topics like Agile, Core BA skills, UML, User stories etc. You can listen to these while travelling or even in your leisure time. An entire chapter is created for situational questions. These questions have become part of every interview these days.
This process model can be represented visually using process flow diagrams such as BPMN or UML. Draw.io: is a free and open-source diagram creation tool that allows you to import BPMN XML files and other types of diagrams such as UML and ER.
What is Class Diagram A Class Diagram is one of the types of UML (Unified Modeling Language) diagrams that represents the static structure of a system. It’s one of the most common UML diagrams used in object-oriented software design.
UML diagrams, DFDs, ER diagrams – be thorough with them. On the D day Now coming to the most importance 3.5 hours of the journey. Need to be really swift in data interpretation and analysis especially in case studies. Technique and more techniques, please focus on mastering them. Time is very crucial. hours are just not sufficient.
But just to summarize these skills: Requirement Elicitation Techniques Requirements Analysis and Modelling UML Modelling User Stories Modelling Writing Requirements Specifications (SRS, FSD etc) SELECT queries in SQL for ad-hoc reporting and testing These skills should get reflected in your resume.
The BABoK and from the PMI Guide include several techniques through analysis and modeling (for example UML and BPMN diagrams ) that help with that. Problem solving After analyzing the problem, the goal of business analysis is to propose solutions by means of the analysis’ outputs.
For instance, if you were responsible for a physics engine, then you would probably have to be able to program in C++, use UML, and apply the right software architecture and design patterns.
The notation used in the video is a simple form of UML. Many analysts consider that UML is too technical and complex to be used for business modelling. This is not correct if UML is used appropriately. In common with most modelling notations , UML comprises mainly rectangles and lines.
Models ranging from the venerable flowchart through structured analysis models, the Unified Modeling Language (UML) diagrams, and the Requirements Management Language (RML) should be part of every BA’s repertoire. Modeling Skills Modeling is a critical skill for business analysts.
It would be useful to learn how to employ tools such as Lucidchart, Microsoft Visio, or UML diagrams. Knowledge and Documentation/Modelling Skills: BAs tend to document and model use cases, process flows, requirements specifications, etc.
Tutorial 3: Skills for Business Analyst Tutorial 4: Understanding Software development process with a case study Tutorial 5: Software Development Life Cycle Methodologies (SDLC Basics) Tutorial 6: Business Analysis Techniques Tutorial 7: What is UML Modelling? Tutorial 8: How do Business Analysts handle the requirements?
It has out-of-the-box shape sets from many common modeling notations like UML and BPMN. Gliffy is an online diagramming tool that allows you to create everything from basic workflow diagrams to BPMN and UML diagrams. It is relatively easy to use and there are a lot of online tutorials.
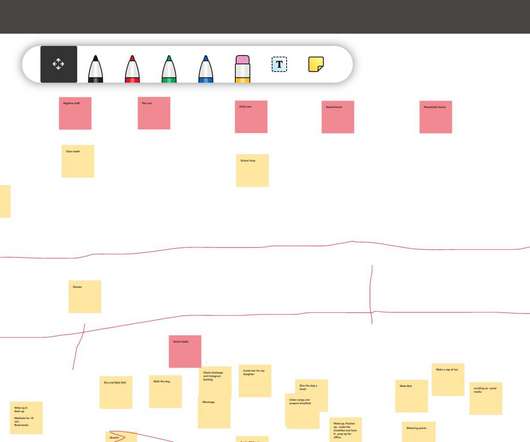
This enables you to draw out BPMN process flows, Wireframes, UML, Mind maps, Flow charts etc. You can then also select different pens to write on the whiteboard too. Scenario 4 – Drawing out business process models or any standard visual model. Tool – Draw.io. Most symbols are available to drag and drop onto a drawing area.
It includes the following: Flow objects Connecting objects Swim lanes Artifacts UML (Unified Modeling Language) UML is used to develop, visualize, and document the software system as it is a modelling standard.
Typically, process models are displayed using either the Unified Modeling Language (UML) or Business Process Modeling Notation (BPMN), two standardized types of graphical business process notation (UML). UML Diagrams One of the widely used methods of business process modelling is the use of UML diagrams.
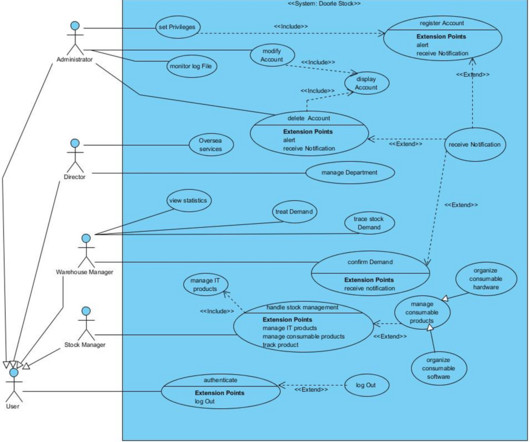
Applying UML “Use Case Diagram” techniques: Warehouse Management System Analysis by Mondoa Image source I like it when someone shares their experience with this technique; as I always say, it needs to be more appreciated nowadays.
Responsibilities: Elicit requirements to understand business needs Provide data-driven solutions to improve efficiency Core Skills Required: Analytical thinking Communication skills and Business Acumen Understanding of business processes Tools and Software: Microsoft Visio and other UML modelling tools Microsoft Excel and PowerPoint Project management (..)
In comparison to UML Activity diagrams, it is more intelligible (at least to non-techies) and more suitable for process analysis and design. Well, Business Process Model Notation (BPMN) is frequently the most appropriate modeling notation for business processes. When compared to simple flow charts, it delivers greater rigor and understanding.
Use case is a type of UML diagram and it’s a visual way of capturing requirements. So there are two techniques which are used, there could be more but these are two of the most important and popular techniques that are use cases and user stories.
Common ERD Mistakes by Yulia Kosarenko All images by the author This insightful article probably highlights all the common mistakes business analysts make when creating Entity-Relationship Diagrams – ERDs – which also apply to UML Class Diagrams.
The UML standard is publicly available and is maintained by the Object Management Group (OMG). The UML standard for use cases It is important to understand that the UML standard for use cases simply defines the components of a use case and gives examples of use case diagrams. We’ll get back to the basics.
Elevate your skills with our exclusive combo offer – the JIRA + UML Modeling + MS-Visio + SQL for Business Analysts course. Upon completion, participants will confidently use Jira for their tasks and master the creation of impactful reports and dashboards.
Another common approach is to use a process mapping tool based on BPMN or UML. While jumping right into user interface design mockups might satisfy the desires of the developers, or the just-do-it users, it can often result in a poorly designed solution or excessive time revising numerous sub-optimized versions.
This comprehensive course goes beyond theoretical knowledge, instilling practical business analysis skills such as UML Modeling, SQL, User Stories, Process Modeling, Prototyping, SRS/BRD preparation, and more.
This course, which is entirely practical and hands-on, will assist you in mastering practical business analysis skills that are widely used in the industry , such as UML modeling, SQL, user stories, SRS preparation, etc. You will succeed in the business analyst interviews thanks to the practical and engaging training.
You can use them to show complex information to the user instead of relying on traditional UML/BPMN. Isometric maps are to ideal to use when you are looking at presenting how web-based/ mobile applications interact with users, databases and other applications. You would not use Isometric map to show a simple user journey flow.
Whereas, in a project dealing with data flows, using an activity diagram comes handy (provided the Business Users are comfortable with UML concepts). For example, in a project dealing with a user interface, it’s a good practice to include wireframes.
We organize all of the trending information in your field so you don't have to. Join 57,000+ users and stay up to date on the latest articles your peers are reading.
You know about us, now we want to get to know you!
Let's personalize your content
Let's get even more personalized
We recognize your account from another site in our network, please click 'Send Email' below to continue with verifying your account and setting a password.


Let's personalize your content