This site uses cookies to improve your experience. To help us insure we adhere to various privacy regulations, please select your country/region of residence. If you do not select a country, we will assume you are from the United States. Select your Cookie Settings or view our Privacy Policy and Terms of Use.
Cookie Settings
Cookies and similar technologies are used on this website for proper function of the website, for tracking performance analytics and for marketing purposes. We and some of our third-party providers may use cookie data for various purposes. Please review the cookie settings below and choose your preference.
Used for the proper function of the website
Used for monitoring website traffic and interactions
Cookie Settings
Cookies and similar technologies are used on this website for proper function of the website, for tracking performance analytics and for marketing purposes. We and some of our third-party providers may use cookie data for various purposes. Please review the cookie settings below and choose your preference.
Strictly Necessary: Used for the proper function of the website
Performance/Analytics: Used for monitoring website traffic and interactions
The newest version of ElegantJ BI includes: Real-Time Cubes: Users have the freedom to work with realtimedata or cached data. The cube engine enables connection to disparate data sources such as databases, CSV files and MDX data sources like Microsoft® SSAS and SAP® BW cubes.
The newest version of ElegantJ BI includes: Real-Time Cubes: Users have the freedom to work with realtimedata or cached data. The cube engine enables connection to disparate data sources such as databases, CSV files and MDX data sources like Microsoft® SSAS and SAP® BW cubes.
The newest version of ElegantJ BI includes: Real-Time Cubes: Users have the freedom to work with realtimedata or cached data. The cube engine enables connection to disparate data sources such as databases, CSV files and MDX data sources like Microsoft® SSAS and SAP® BW cubes.
With advanced analytics, flexible dashboarding and effective datavisualization, FP&A storytelling has become both an art and science. I’ve worked with hundreds of dashboard and datavisualization projects over the years. Today, only 35% of organizations say their c-suite executives have access to real-timedata.
Today, Microsoft’s Power BI leads the market of BI-a-a-S, being an excellent tool for data collection, analyzing and visualization. Unique feature: custom visualizations to fit your business needs better. Advantages: timely feedback on any issue and unpaired support from the Microsoft team. QlickSense.
This significantly reduces the amount of time needed to engage in data science tasks. A text analytics interface that helps derive actionable insights from unstructured data sets. A datavisualization interface known as SPSS Modeler. Neptune.ai. Neptune.AI is another popular hardware accelerator.
Dynamic visual storytelling using SAP Analytics Cloud can reimagine your business intelligence, analytics, and reporting with real-timedata. The post Benefits of Creating Dynamic Visual Stories Using SAP Analytics Cloud appeared first on Fingent Technology. Give something […].
Data Collection Techniques in Football Tracking Player Movements GPS trackers worn by players record their every move on the field. This data is then transformed into heat maps and visualizations, revealing crucial patterns in player positioning, running distances, and even fatigue levels.
When you don’t spend long hours gathering stats from all kinds of different formats, when your real-timedata is always at hand, and when you have a clear picture of what’s going on at the moment, you can react faster and better. Sisense processes data a lot faster compared to many other similar BI tools.
Criteo has talked about some of these breakthroughs with machine learning and personalization , which include a greater availability of real-timedata and ability to mine and process it more quickly. If you want to make the most of this interactive channel, you must use data analytics to: Review it with a new coat of paint.
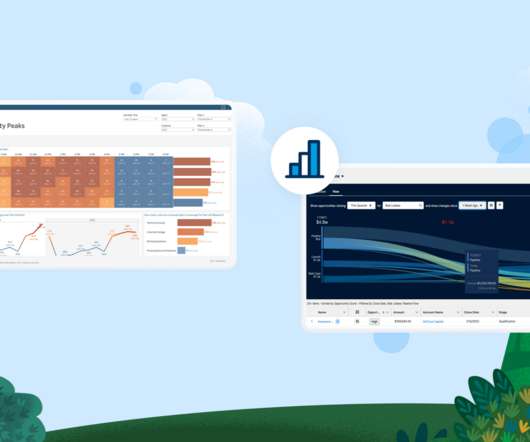
But when BI dashboards are seamlessly linked, organizations can: Monitor business health in real-time : When BI dashboards are fully integrated, businesses can move beyond relying on outdated, end-of-month reports. Real-timedata provides a constant pulse on business health, enabling quicker, more accurate decision-making.
” Tools like SAP Signavio help you visualize and optimize these workflows for consistency and efficiency. But isn’t that what we’ve always been doing with business process workflows? After all, traditional business processes definitions involve structured steps”If X happens, do Y.”
Table of Contents 1) The Benefits Of DataVisualization 2) Our Top 27 Best DataVisualizations 3) Interactive DataVisualization: What’s In It For Me? 4) Static vs. Animated DataVisualizationData is the new oil? No, data is the new soil.”
exabytes of data every day, there’s no question that data management, analysis, and visualization are critical to business success. What isn’t as cut and dry is how fresh that data needs to be in order for businesses to extract the necessary insights for their brands. It’s reliable. It’s reliable.
Here’s a brief comparison: Tableau: For datavisualization specialists, Tableau is more preferred. It features rich visualizations with highly interactive dashboards. Advanced Reporting: Path layer for Azure Map Visual. Visual calculations within reports. Small multiples for new card visual.
It is essential for value investors, who want to predict their future income or deploy high-frequency strategies, to capture broad, real-timedata. However, value investors cannot use broad data to make risk-free decisions since it is not specific enough. Investors can present their big data using visually rich tools.
Deloitte actually wrote a white paper on this topic , which pointed out that data analytics helps improve the decision-making infrastructure and make smarter decisions by leveraging real-timedata. They can also use visualdata to better conceptualize their tax situations. Dealing with Filing Issues.
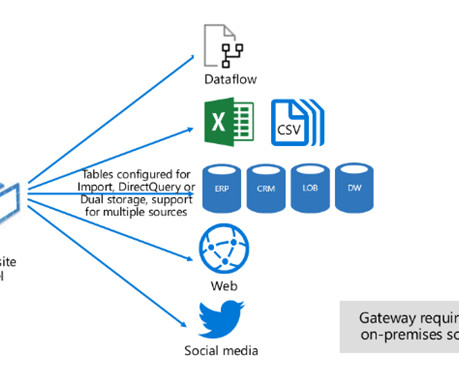
Once imported, reports rely on this cached data rather than querying the source system. Scenarios requiring offline access to reports where real-timedata is not essential. Best Practices: Optimize Data Volume: Import only the data you need by filtering rows and excluding unnecessary columns.
The ACI provides coaching and data support to these communities based on the principles of the Built for Zero model by Community Solutions. Advocates acquire real-timedata that allows communities to measurably drive towards reducing and then ending homelessness for young people.
The ACI provides coaching and data support to these communities based on the principles of the Built for Zero model by Community Solutions. Advocates acquire real-timedata that allows communities to measurably drive towards reducing and then ending homelessness for young people.
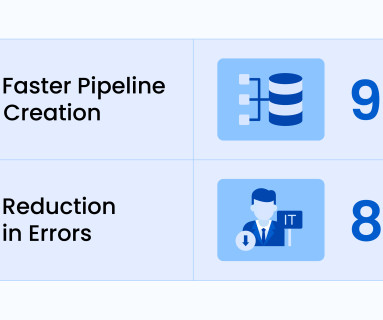
Key Features No-Code Data Pipeline: With Hevo Data, users can set up data pipelines without the need for coding skills, which reduces reliance on technical resources. Wide Source Integration: The platform supports connections to over 150 data sources. Top 8 Hevo Data Alternatives in 2025 1.
Lack of Real-TimeData: Making decisions without real-timedata is like sailing without a compass. Real-timedata is essential for quick, informed decisions. Real-TimeData Utilization: Use tools like Apptio for real-timedata.
Seamlessly integrating dashboards, visualizations, and reports into end users’ products, apps, and web portals expedites decision-making by putting data and insights where people are already working. 1 Timely, accurate, dynamic data that’s easy to use . June 6, 2022 - 11:36pm. June 7, 2022.
Cutting down latency or delay is now one of the most crucial elements of business intelligence strategy in present times. As a data analytics company, we have been observing a trend among certain large enterprises who are looking for real-timedata streaming for analytics. Visual Analytics and DataVisualization.
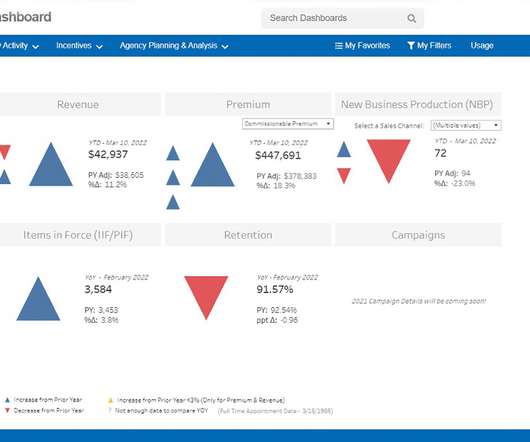
Your KPIs will help to shape the direction of your dashboards as these metrics will display visual representations of relevant insights based on specific areas of the business. If your dashboard is visually organized , users will easily find the information they need. Don’t go over the top with real-timedata.
Having that real-timedata at his fingertips has also allowed Ray and his team to get a sense as to where Domo employees are with the pandemic, from how they’re feeling about it to how that feeling matches up with how the virus is trending in places where Domo has a physical presence, including Utah, Japan, Australia and the U.K.
Cloud data integration requires different tools and capabilities than integration for system applications. It is focused on accessibility of the data from any source, allowing business users to create visualizations—with the flexibility and the power of the cloud. Emphasize performance, cost reduction, and control.
Data dashboards provide a centralized, interactive means of monitoring, measuring, analyzing, and extracting a wealth of business insights from relevant datasets in several key areas while displaying aggregated information in a way that is both intuitive and visual. Data being spread out amongst many databases.
The visualizeddata will address common but nagging issues like in-stock position and product availability, online customer journey, competitive pricing, supply chain optimization, and loyalty program analysis, among others. In the next example, see the product data, category, or sub-category rolled up to the individual grocer.
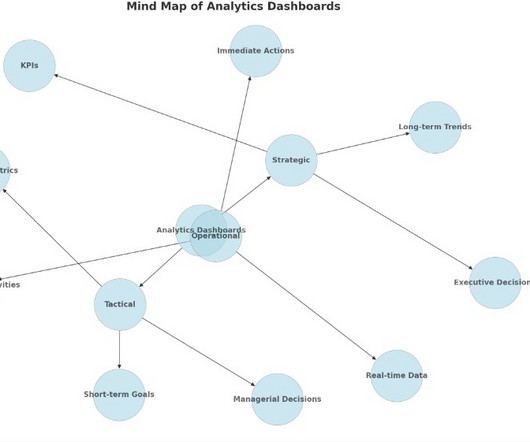
Operational dashboards are for frontline workers and operational staff, offering real-timedata on the organization’s day-to-day operations. Tactical dashboards serve middle management with detailed insights, and operational dashboards deliver real-timedata for frontline staff.
Realtime business intelligence is the use of analytics and other data processing tools to give companies access to the most recent, relevant data and visualizations. This allows dashboards to show both real-time and historic data in a holistic way. Who Uses Real-Time BI?
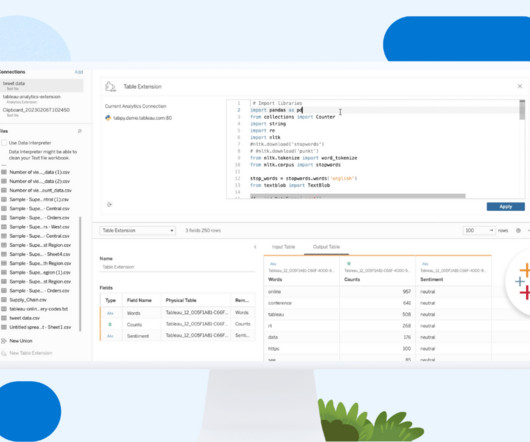
By using Table Extensions, you can easily integrate scripts and advanced functions into Tableau to build complete predictive models, transform and shape your data, call web APIs to get real-timedata, and more. Then you can use the output downstream to explore and visualize the data.
That interactivity is indeed what drives a profitable result by visually depict important data which can be accessed by different departments. Cloud-based, real-time online datavisualization software enables fast, data-driven action by decision-makers. Digital age needs digital data.
Here we take the time to define business report, explore visual report examples, and look at how to write one for various needs, goals, and objectives. In the process, we will use an online datavisualization software that lets us interact with, and drill deeper into bits and pieces of relevant data.
It’s a new day for business because we have data to help us understand what customers need, make smarter decisions, and take action fast. Data helps us innovate not only technology, but also customer experiences. And companies need real-timedata and analytics, a single source of truth, to meet changing customer expectations. .
It’s a new day for business because we have data to help us understand what customers need, make smarter decisions, and take action fast. Data helps us innovate not only technology, but also customer experiences. And companies need real-timedata and analytics, a single source of truth, to meet changing customer expectations. .
Seamlessly integrating dashboards, visualizations, and reports into end users’ products, apps, and web portals expedites decision-making by putting data and insights where people are already working. 1 Timely, accurate, dynamic data that’s easy to use . June 6, 2022 - 11:36pm. June 7, 2022.
Plus, consistent business language applied to every data model helps everyone to understand the data’s context and make decisions with confidence. The new Tableau Einstein Workspace combines connectivity, data prep, semantics, visualizations, and more in the flow of analysis.
Realtime BI is the application of analytics and data processing tools to gain insight into relevant data and visualizations as they’re created. As visualizeddata presents itself, realtime analysis empowers the user to draw swift conclusions that are both informed and accurate.
Creates data models, streamlines ETL processes, and enhances Power BI performance. ollaborates with analysts and IT teams to provide smooth data flow. Mid-Level Positions (4-8 years experience) Senior Power BI Data Analyst: Directs datavisualization projects, enhancing report usability and design.
As executives increasingly rely on data and analytics to drive informed financial and operational decisions, this acquisition brings complementary business intelligence (BI) and operational analytics to insightsoftware’s market-leading portfolio of real-timedata, reporting and analytics for finance teams.
When these reports are backed up with powerful visualizations developed with a dashboard creator , no information can stay hidden, eliminating thus the possibility of human errors and negative business impact. 4) Make your report visually pleasing through focus. 7) Strike a balance with your datavisualizations.
As another example, if your sales went up by 10%, Sisense might explain that the increase was attributable to both a specific product category and a certain age group of customer with a visual display of the breakdown. so why should you limit your data-driven decisions to those hours?
We organize all of the trending information in your field so you don't have to. Join 57,000+ users and stay up to date on the latest articles your peers are reading.
You know about us, now we want to get to know you!
Let's personalize your content
Let's get even more personalized
We recognize your account from another site in our network, please click 'Send Email' below to continue with verifying your account and setting a password.


Let's personalize your content