This site uses cookies to improve your experience. To help us insure we adhere to various privacy regulations, please select your country/region of residence. If you do not select a country, we will assume you are from the United States. Select your Cookie Settings or view our Privacy Policy and Terms of Use.
Cookie Settings
Cookies and similar technologies are used on this website for proper function of the website, for tracking performance analytics and for marketing purposes. We and some of our third-party providers may use cookie data for various purposes. Please review the cookie settings below and choose your preference.
Used for the proper function of the website
Used for monitoring website traffic and interactions
Cookie Settings
Cookies and similar technologies are used on this website for proper function of the website, for tracking performance analytics and for marketing purposes. We and some of our third-party providers may use cookie data for various purposes. Please review the cookie settings below and choose your preference.
Strictly Necessary: Used for the proper function of the website
Performance/Analytics: Used for monitoring website traffic and interactions
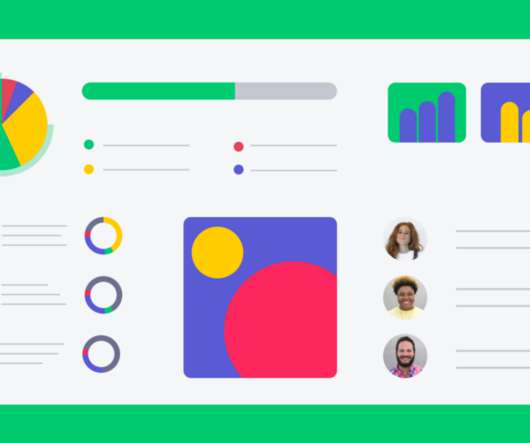
CHARLESMINGUS Overview The appeal of visualization is rooted in biology. The brain simply processes images better than words, devoting more than half its processing power to this task; the human eye tends to seek out and focus on visual stimuli that are easy to recognize including color, shapes, and patterns. Thats creativity.
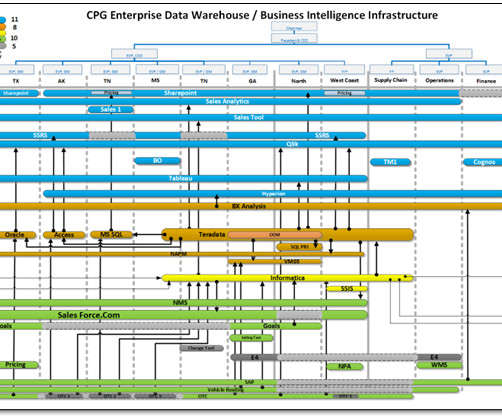
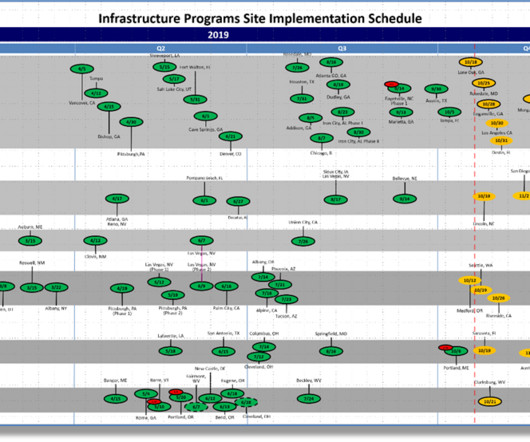
More importantly, we need to consider an alternative way of thinking Manuel Lima , Visual ComplexityMapping Patterns of Information Making Program Management More Challenging Program management is inherently difficult but becomes even more challenging when confronted with ineffective program modeling, performance monitoring, or reporting.
Steven Pinker Information graphics, or infographics, are visual representations o. Cognitive psychology has shown that the mind best understands facts when they are woven into a conceptual fabric, such as a narrative, mental map, or intuitive theory. Disconnected facts in mind are like unlinked pages on the Web: They might as well not exist.
If you are considering a Business Intelligence solution, you ought to give some consideration to the concept of Smart Data Visualization and review your prospective solution to determine its capabilities in that regard. How do users perceive and use data? How do formats and reporting affect a user’s understanding of data?
Technology created for consumer or internal use ends up requiring much of the same projectmanagement work. The main difference is that IT projectmanagement can end up being more complex because implementation and maintenance may span multiple departments and require difficult integrations and version changes.
As a digital projectmanager, staying up to speed on all the skills, tech, and tech-skills you need can be challenging. That’s why we’ve teamed up with HubSpot to bring you the must-have skills and projectmanagement tools that will help your team make a lasting business impact.
Projectmanagement is a set of principles, tools, and techniques to plan, execute and manageprojects. It helps projectmanagers, and all the leaders to manage work while supporting team collaboration. There are a variety of projectmanagement methodologies. Agile ProjectManagement.
Projectmanagement tools and techniques have been widely used in the world of business for decades. Projectmanagement tools and methods are easily adapted for academic environments to streamline lab work and improve students’ productivity. This method uses visual cards to denote the completion of tasks.
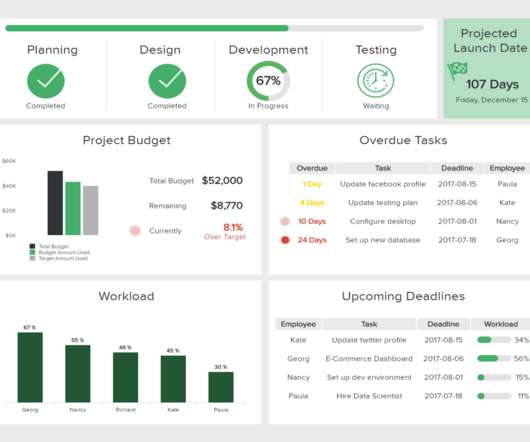
But despite the business-boosting potential (and vital importance) of successfully delivering collaborative strategies, a mere 58% of organizations understand the value of projectmanagement to its fullest, according to the global survey conducted by the ProjectManagement Insitute. What Is A ProjectManagement Dashboard?
With remote working being the new normal in the post-pandemic era, organizations worldwide are finding it hard to manage employee activities and business tasks in remote working models. Projectmanagers are turning to Agile projectmanagement frameworks like Trello Kanban boards to make their teams more agile and productive.
If this rings a bell, it’s probably time that you upgrade your projectmanagement tracking tools. In this post, we’ll showcase a better projectmanagement tracker and take a look at 5 customizable templates that blow your Excel sheets out of the water. What is a projectmanagement tracker? Get started.
This includes levels of managers and employees securing new projects and helping the business continually move forward. This is where portfolio management vs. projectmanagement comes into play. Portfolio management vs. projectmanagement: what’s the difference? Portfolio management.
Is there a difference between program management and projectmanagement? In this article, we’re going to take a look at the differences between program and projectmanagement, provide examples of each, and show you how to make your program and projectmanagement efforts more efficient. In short, yes.
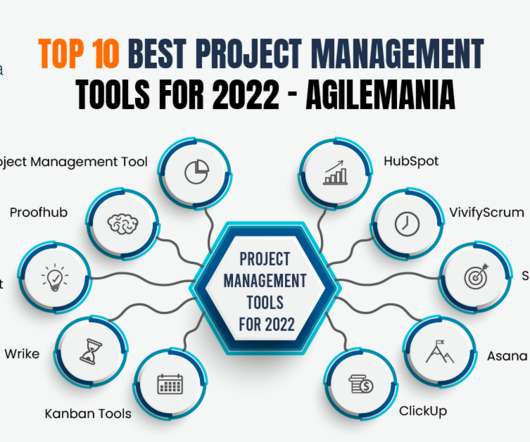
For any organization, projectmanagement tools are a necessity. As the importance of projectmanagement tools becomes more widespread, it is no surprise that there is an abundance of reliable tools on the market. In this competitive world, it is important to have a successful projectmanagement tool.
Whether you’re working on your latest blog post or planning your social media calendar , even individuals can benefit from projectmanagement software to help them overcome distractions and focus on the task at hand. Let’s dive into how to smash your goals and be more efficient with projectmanagement software.
A good cost breakdown structure is a fundamental element of projectmanagement. It helps you regain cost control and makes sure the numbers stack up at every stage of the projectmanagement lifecycle. Though most people know the importance of cost control, many struggle to manage it. Step 3: Build in contingency.
In this article, we’re going to explain what a critical path is in projectmanagement, why it’s important, how to use it, and how work management software like monday.com makes the process a whole lot easier. How can a critical path help in projectmanagement? Try our projectmanagement plan template! .
Are you thinking about hiring your company’s or team’s first projectmanager? Are you exploring the idea of training your team in projectmanagement principles? In this post, we’ll cover the tangible, research-backed benefits of projectmanagement. What are the benefits of projectmanagement?
ProjectManagers / Scrum Masters: They care about timelines and resources. As a BA, I ensure that what we prioritize fits both the business value and project constraints. This visual helps stakeholders focus on whats most valuable, fast. Its not rigidI tailor the weights or even the methods depending on the project.
Data Visualization. Did you know visualization has been in use since (and well before that as well) 1824 AD to develop an Egyptian map – the Turin Papyrus Map. With the overwhelming volume and rate at which data grows, it is almost impossible to do it without visual help. Creating Good Visualizations.
Without the structure of teams typical to high techs or agencies, freelancers are not only tasked with producing great content but self-managing all the processes and tools they use to get it done right—and efficiently. What is projectmanagement software? Why do freelancers need projectmanagement software?
Before getting into details of the hiring process, it’s necessary to have a clear vision of what kind of specialists your project may require. Projectmanager. These employees will focus on the visual appearance of the end product, its consistency, shapes, colors, and other aspects. UI/UX designer.
Visualizing your processes helps you and your team understand the definitions, purposes, and overall im. Your business may have different processes in place for anything from onboarding to launching new products. Read More.
Introduction In the realm of Agile projectmanagement, efficient tracking and visualization of work progress are essential for teams to stay on course and deliver high-quality products within specified timeframes. One valuable tool in this context is the Sprint Burndown Chart.
As a projectmanager, you can help. Of senior managers interviewed by Robert Half , 96 percent said their employees are experiencing some level of burnout. As a projectmanager, it's your job to push your employees. The employees you know for their passion and motivation are at risk for burnout. Here's how.
Introduction In the realm of Agile projectmanagement, efficient tracking and visualization of work progress are essential for teams to stay on course and deliver high-quality products within specified timeframes. One valuable tool in this context is the Sprint Burndown Chart.
Whether it’s sharing files, integrating projectmanagement software with real-time communication solutions, or even the Gmail Microsoft Teams integration that’s bridging the gap for teams all around the world. In many ways, employees can work just as productively as they would in the office. Utilization of Chatbots.
Proper goal measurement allows you – and everyone on the team for that matter – to see how the goal is progressing at all stages of the project. There are numerous ways to measure goals – reports, dashboards, KPIs and OKRs – and other visual means make it simple and straightforward to track daily and weekly progress against your goals.
Big data technology is becoming extremely important for projectmanagement in 2021. A growing number of companies are finding new ways to use data-driven tools to streamline various aspects of their projects, including editing workflows. There are a lot of big data tools that make workflow management a lot easier.
Projectmanagement is a systematic approach to planning, executing, and controlling projects to achieve specific goals within defined constraints. It plays a pivotal role in various industries, ensuring that projects are completed efficiently, on time, and within budget. Tools like Gantt charts help visualize schedules.
A Product Designer is a full-stack designer who does UX, UI, coding, projectmanagement, and of course, problem-solving (most importantly). UX designers can anticipate how customers will respond to many visual elements based on past customer engagement data. Who is a Product Designer? How UX Designers Use AI.
In today’s fast-paced world, effective projectmanagement is essential for businesses and organizations to stay competitive and deliver successful outcomes. GanttProject is a powerful projectmanagement software tool that helps individuals and teams plan, schedule, and manage their projects efficiently.
ProjectManagement software – Projectmanagement is a crucial element in the success of any kind of business. Whether you’re working on a personal project, a small business venture, or within a large organization, having the right projectmanagement softwares at your disposal can make all the difference.
Are scattered searches for projectmanagement software reviews leaving you frustrated? Maybe you’ve narrowed the search by price or features but you aren’t sure if the ProjectManagement software is too simple or far too robust for your team’s size? Get in touch What is projectmanagement software?
Lead and lag are scheduling techniques used with task relationships like Finish-to-Start and Start-to-Start when managingproject dependencies. Projectmanagers use lead and lag time when creating project schedules to ensure that activities are completed efficiently and effectively.
Projectmanagement is critical because it provides the leadership, motivation, and roadblock-removals that help teams introduce new products or services, grow revenue, and meet other company goals. According to a study by the ProjectManagement Institute: In 2020, 11.4%
So what exactly is a critical chain, and how does it help achieve projectmanagement success? Critical chain” is a part of our ProjectManagement Glossary — check out the full list of terms and definitions. What is a critical chain in projectmanagement? How to use a critical chain in projectmanagement.
Projectmanager interview questions and how to answer them Got an interview coming up for your dream projectmanagement role? However, as a projectmanager, you know that the secret to success is preparation. Get started What makes a great projectmanager? Congratulations! Less than 1 minute?
” This mindset is comparable to a particular practice in projectmanagement — decomposition projectmanagement. Oftentimes, the most worthwhile projects are the ones that can feel overwhelming at the start. What is decomposition projectmanagement? Large projects become less overwhelming.
Projectmanagement is an ever-evolving field that requires a thorough understanding of various methods and techniques to ensure the successful completion of projects. One of the key elements of projectmanagement is conducting a SWOT analysis. What is a SWOT analysis in projectmanagement?
These might seem unrelated to projectmanagement, but they’re actually great visuals for what projectmanagement bottlenecks might look like. This article defines bottlenecks in projectmanagement and provides some real-world examples. What is the bottleneck effect in projectmanagement?
In a literal sense, it is a gate between phases or stages of a project, where the gatekeeper decides if the project should pass into the next stage. There are various names for projectmanagement gates, including: stage gates. Gate reviews confirm that current projects are still: Required by the business.
Agile projectmanagement has its roots in software development, but today it’s used widely in everything from marketing campaign management to scientific research. If you want to understand the fundamental principles behind the agile approach, you might want to consider Agile projectmanagement certification.
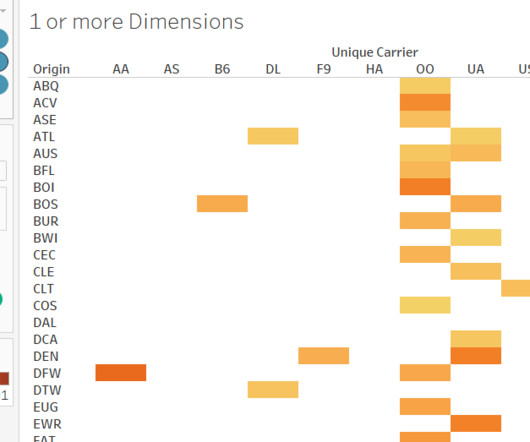
Heat and Tree Maps We are going to look at two important visualizations which are used in many different fields for analysis. Heat Maps In these visualizations, the color shade of areas varies as per the values in the data. They are great for visualizing statistical data as well.
We organize all of the trending information in your field so you don't have to. Join 57,000+ users and stay up to date on the latest articles your peers are reading.
You know about us, now we want to get to know you!
Let's personalize your content
Let's get even more personalized
We recognize your account from another site in our network, please click 'Send Email' below to continue with verifying your account and setting a password.


Let's personalize your content