Remove Magazine Remove Presentation Remove Visualization
article thumbnail

Serving Customers with Virtual Reality in the Metaverse

Smart Data Collective

CUSTOMER Magazine actually says that VR is the future of customer service. They can explore different rooms, amenities, and even visualize themselves in the space, helping them make more informed choices. Virtual Events : Virtual reality can create immersive experiences for virtual events, conferences, or product launches.


article thumbnail

Marie Kondo Has Some Advice for Your Dashboard

Juice Analytics

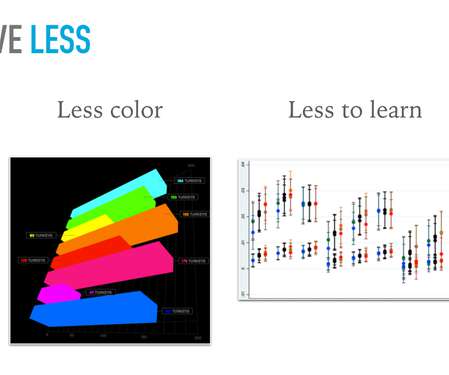
In our workshops on data storytelling, dashboard design, and data visualization, we are always emphasing the need to simplify. You can also cut out photos from magazines. Tidying up means we only showcase the data that brings us direct, clear value — everything else should be discarded from our presentations. Less is more.

Insiders

Sign Up for our Newsletter

This site is protected by reCAPTCHA and the Google Privacy Policy and Terms of Service apply.

article thumbnail

A Guide to Building Better Data Products

Juice Analytics

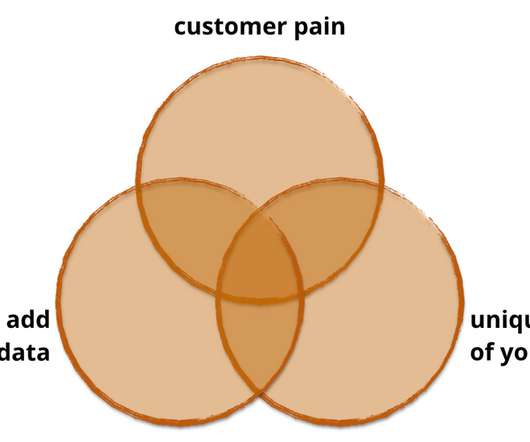
However, the data was essentially stored in old copies of the paper magazine, not a format that was conducive to delivering insights to their target audience. (3) There are many paths to consider: Visual representations that reveal patterns in the data and make it more human readable. Just kidding!

article thumbnail

Business Analysis Digest #35

Passionate BA

It highlights the power of combining data, narrative, and visualizations to communicate findings effectively. The article suggests applying data storytelling techniques in user research by forming a narrative around audience tension, visualizing key aspects and insights, and providing clear design recommendations or actionable next steps.

article thumbnail

Take Advantage Of The Top 16 Sales Graphs And Charts To Boost Your Business

Data Pine

The question and answer we included come from an actual interview that Fortune magazine did with billionaire Tilman Fertitta. This gives to that sales graph an overall sense of visual contrast which makes it much more digestible at a glance. Download our free executive summary and boost your sales strategy! From Fiction To Reality.

article thumbnail

Holiday Gift Guide for Data Nerds

Juice Analytics

The following list is a fragrant mix of self improvement, everyday products with visualizations, data art, and data books for kids. A subscription to the Nightingale Magazine is a gift for anyone that loves to learn but also appreciates the touch and feel of the printed word. Happy Holidays!

article thumbnail

How To Create Data Reports That Will Skyrocket Your Business Performance

Data Pine

Data report is an evaluation tool used to assess past, present, and future business information while keeping track of the overall performance of a company. Data reports present the data, analyses, conclusions, and recommendations in an easy to decipher and digest format. What types of data reporting do you need to present?