Remove Financial Analysis Remove Presentation Remove Retail
article thumbnail

What Are Business Reports And Why They Are Important: Examples & Templates

Data Pine

The different sets of visual representations of data can clearly point out specific trends or actions that need to be taken in order to stay on the financial track of a company. All your financial analysis can be integrated into a single visual. Retail store dashboard company report example. click to enlarge**.

Retail 119
article thumbnail

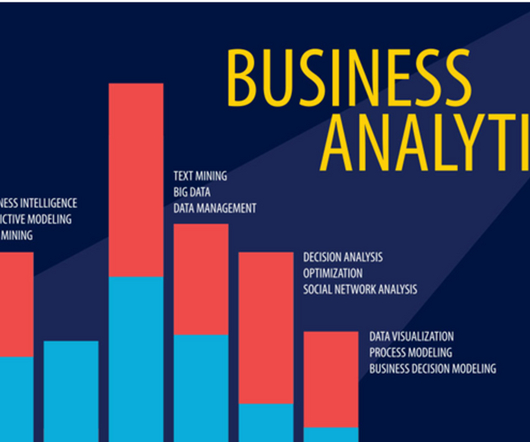
A beginner’s guide to start a career in Business Analytics

Analysts Corner

Some of the most common applications of business analytics include market research, financial analysis, supply chain management, and customer relationship management. This includes presenting your analysis in a way that’s easy to understand and making recommendations based on your findings.

Insiders

Sign Up for our Newsletter

This site is protected by reCAPTCHA and the Google Privacy Policy and Terms of Service apply.

article thumbnail

What Is Ad Hoc Reporting? Your Guide To Definition, Meaning, Examples & Benefits

Data Pine

Ad hoc data analysis is the discoveries and subsequent action a user takes as a result of exploring, examining, and drawing tangible conclusions from an ad hoc report. Now that you know the ad hoc analysis meaning, it is time to look into the benefits, and afterward, real-world and practical examples.

Retail 104
article thumbnail

What is Enterprise Automation?

Argon Digital

Accounting activities include record-keeping, forecasting, payroll processing, accounts receivable/accounts payable, financial analysis, and more. Accounting automation simplifies and accelerates financial workflows by digitizing and automating tasks like data processing, document management , and financial analysis.

article thumbnail

All You Need to Know About Data Aggregation

Astera

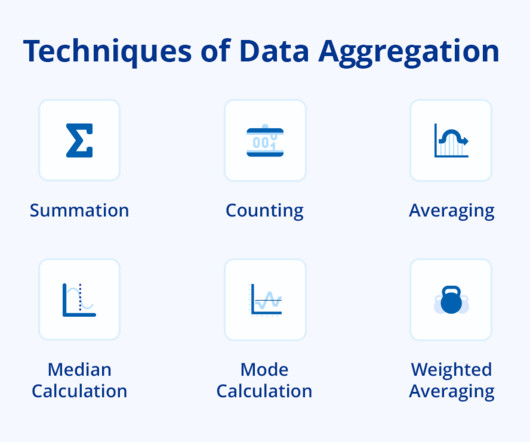
This aggregation type is preferable to conduct trend or pattern analysis over time. Temporal aggregation is extensively utilized in time-series modeling, financial analysis, and economic forecasting. These platforms support complex data aggregation and analysis tasks across finance, operations, and marketing.

article thumbnail

A Complete Guide to Data Analytics

Astera

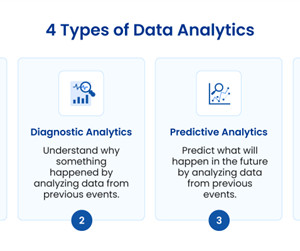
Statistical Analysis : Using statistics to interpret data and identify trends. Data Visualization : Presenting data visually to make the analysis understandable to stakeholders. Effective visualization techniques are crucial for presenting complex data in an accessible format.

article thumbnail

11 Financial Model Examples & Templates for 2021

Insight Software

Financial models offer data-driven, quantitative analysis that tells you where your company stands and where it’s heading. As a finance professional, you’ll need different types of financial analysis and modeling for different situations. That being said, one model can’t do it all. Organic business growth.