This site uses cookies to improve your experience. To help us insure we adhere to various privacy regulations, please select your country/region of residence. If you do not select a country, we will assume you are from the United States. Select your Cookie Settings or view our Privacy Policy and Terms of Use.
Cookie Settings
Cookies and similar technologies are used on this website for proper function of the website, for tracking performance analytics and for marketing purposes. We and some of our third-party providers may use cookie data for various purposes. Please review the cookie settings below and choose your preference.
Used for the proper function of the website
Used for monitoring website traffic and interactions
Cookie Settings
Cookies and similar technologies are used on this website for proper function of the website, for tracking performance analytics and for marketing purposes. We and some of our third-party providers may use cookie data for various purposes. Please review the cookie settings below and choose your preference.
Strictly Necessary: Used for the proper function of the website
Performance/Analytics: Used for monitoring website traffic and interactions
A business process is the logical sequence of events that lead to a particular outcome relevant to your organization. A process includes all the activities or tasks in a chain of events that accomplishes something. UML diagram. UML diagram. Here’s where UML comes in handy. Data flow diagram. Gantt chart.
Techniques like Scope modeling or Context diagrams also allow early discussions on the main (business) events — ie, prior to the solution events — and external entities that surround our problem. The way it places user stories in their usage context allows prioritizing and sequencing their delivery within the big picture.
BPMN is the visual language that bridges the gap between stakeholders’ requirements and the workflow which includes actions, events, activities, artifacts, and connections between the objects. In comparison to UML Activity diagrams, it is more intelligible (at least to non-techies) and more suitable for process analysis and design.
It would be useful to learn how to employ tools such as Lucidchart, Microsoft Visio, or UML diagrams. There are several websites where one can locate such templates and write remembering case studies or fictional events. Attempt to formulate example requirements as well as draft rudimentary business cases.
Applying UML “Use Case Diagram” techniques: Warehouse Management System Analysis by Mondoa Image source I like it when someone shares their experience with this technique; as I always say, it needs to be more appreciated nowadays. Upcoming business analysis events 17.08, 8 PM CEST. Business Analysis Conference 2023 by IRM UK.
Common ERD Mistakes by Yulia Kosarenko All images by the author This insightful article probably highlights all the common mistakes business analysts make when creating Entity-Relationship Diagrams – ERDs – which also apply to UML Class Diagrams. Upcoming business analysis events 06.09, 6 PM CEST.
Therefore, it includes critical data, metrics, and events from the past. Typically, process models are displayed using either the Unified Modeling Language (UML) or Business Process Modeling Notation (BPMN), two standardized types of graphical business process notation (UML).
It can show the events, such as a customer calling to place an order, that trigger the process and its activities/tasks to start. The UML standard is publicly available and is maintained by the Object Management Group (OMG). The UML specification comments, use cases are typically specified in various idiosyncratic formats.
You can use them to show complex information to the user instead of relying on traditional UML/BPMN. By plotting emotions against certain events within the journey, will give you an insight into what drives the user’s behaviour. You would not use Isometric map to show a simple user journey flow. Customer Journey Map.
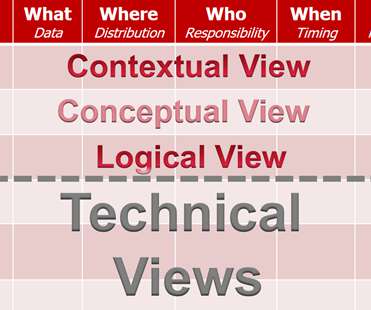
If using the Unified Modeling Language (UML) , for example, the models in the lower rows will feature additional icons and ‘adornments’. Organisations must continually improve their ability to align themselves and their processes with the changing external environment and to rapidly adapt their responses to business events.
If using the Unified Modeling Language (UML) , for example, the models in the lower rows will feature additional icons and ‘adornments’. Organisations must continually improve their ability to align themselves and their processes with the changing external environment and to rapidly adapt their responses to business events.
E ntities are representations of actual objects, concepts, or events found in the data set which needs model ing. Different notations and conventions, such as the Unified Modeling Language (UML) , are used to define these relationships and to visually represent and document the connections between entities and their attributes.
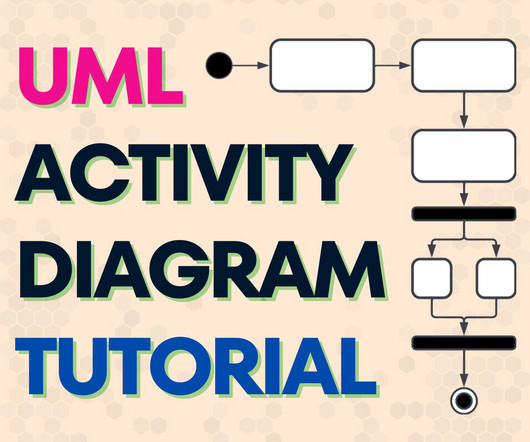
What is the UML Activity Diagram Do you know how to create UML Activity Diagram? UML Activity Diagrams are perfect for illustrating workflows or processes. Real-World Applications UML Activity Diagrams are versatile and applicable in various contexts. I am sure that many of you do know that.
An object diagram would illustrate some concepts and their relationships, while a sequence diagram would show the order of actions or events; a state diagram would visualize how an entity is changing as a result of of some events. But if you want to do in a scalable way, probably you would need to follow some conventions.
We organize all of the trending information in your field so you don't have to. Join 57,000+ users and stay up to date on the latest articles your peers are reading.
You know about us, now we want to get to know you!
Let's personalize your content
Let's get even more personalized
We recognize your account from another site in our network, please click 'Send Email' below to continue with verifying your account and setting a password.


Let's personalize your content