This site uses cookies to improve your experience. To help us insure we adhere to various privacy regulations, please select your country/region of residence. If you do not select a country, we will assume you are from the United States. Select your Cookie Settings or view our Privacy Policy and Terms of Use.
Cookie Settings
Cookies and similar technologies are used on this website for proper function of the website, for tracking performance analytics and for marketing purposes. We and some of our third-party providers may use cookie data for various purposes. Please review the cookie settings below and choose your preference.
Used for the proper function of the website
Used for monitoring website traffic and interactions
Cookie Settings
Cookies and similar technologies are used on this website for proper function of the website, for tracking performance analytics and for marketing purposes. We and some of our third-party providers may use cookie data for various purposes. Please review the cookie settings below and choose your preference.
Strictly Necessary: Used for the proper function of the website
Performance/Analytics: Used for monitoring website traffic and interactions
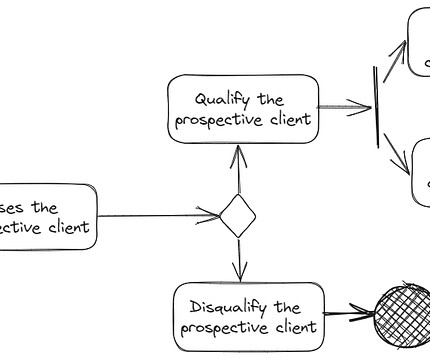
In the previous post , I spoke about documenting user story acceptance criteria using text. In this article, I want to speak about more visual formats for spelling out requirements and acceptance criteria. I will primarily focus on process diagrams (BPMN) and flowcharts. Then, an idea came to me.
Business Analysis and Product Ownership By the time agile started kicking in for teams that were working in a waterfall setting, one of the topics discussed at the time was the “disappearance” of the Business Analyst (BA) role. Business analysis practitioners are introduced as problem solvers.
Maybe you’ve experienced something that took longer than expected, where you had to jump through hoops that made no sense, or where you could clearly see the process could run more smoothly. Processanalysis is the first step to making processes better. What exactly is processanalysis? Decreasing costs.
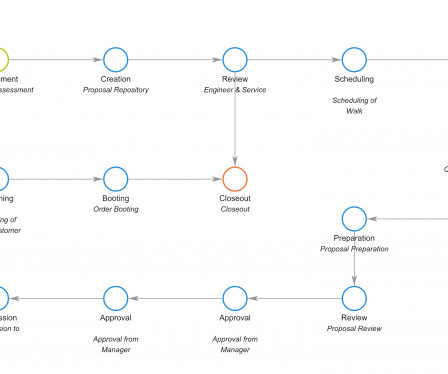
Process Design Documents (PDD) and Process Models are common mechanisms used by business analysts, business process architects, and Enterprise Business ProcessAnalysis (EBPA) teams to visualize and document that steps of a business process.
BPMN is the visual language that bridges the gap between stakeholders’ requirements and the workflow which includes actions, events, activities, artifacts, and connections between the objects. In comparison to UML Activity diagrams, it is more intelligible (at least to non-techies) and more suitable for processanalysis and design.
Experiment with a new visual model to clarify a complex concept. Consider a new type of requirements document to address a currently unmet need, such as a business process model, scope statement, or use case. Goals in this area could include updating a template , documenting an as is process , or creating a tip sheet.
So, after you’ve identified the steps and events of the process, you need to make sure your sequencing is correct. This will be shown as a decision node in the process flow. It is customary to use a diamond shape to indicate a decision, but different notations may have different visuals for it. Seems simple.
Model Techniques from BABOK Guide v3 From IIBA’sBABOK Guide v3 a business process model is defined as: “…a visual representation of the sequential flow and control logic of a set of related activities or actions.” Models are a means to visualize the steps of a complex or multi-stage process.
My 7 tips for becoming a good BA Elicitation, documentation, validation, adaptation and stakeholder conflict mitigation are all things I never thought I would get myself into when I decided to shift careers and become a business analyst just over a year ago. Visualize, Visualize and Visualize! Think of the user, ALWAYS!
The processes that describe how the business currently works are called the as-is or current-state processes. Those that describe the envisioned future state of how the business will operate are called the to-be processes. What about the ProcessAnalysis Space? Business process acronyms galore.
Generally, agility incorporates the following elements, all of which are included to CMW Platform: Process management: With CMW Platform , process management comes in the form of visual workflows that you can change on-the-fly. Process efficiency rises when operations run smoothly and at full capacity. capabilities.
The demands of The Business Analyst Blueprint® program are significant – there are 4 modules in 4 key skill areas – business processanalysis, use cases and wireframes, data modeling, and the business analysisprocess framework. The ACBA on the other hand is an applied certification.
I’ll be sharing specific techniques for business processanalysis , use cases , and data modeling , as well as success stories from ACBAs. We’ve got document management tools. COTS Requirements: Business ProcessAnalysis. COTS Requirements are Critical to Project Success. And then Archer is another one.
I heard you mentioned process. Let’s take the business processanalysis module. John Sim: Yeah, it was trying to visualize it so that people can understand. If it’s a document it shows the document icon. If it’s a process, there is a physician. You visualize. Let me simplify.
Our core teachings are around processanalysis, like in processanalysis , use cases , data modeling , which goes to that glossary of terms that you were talking about, and how to manage a whole project or really an initiative. So you could not have said it better, exactly. That is just naturally part of what we do.
Work Product Requirements Model Requirements Document Requirements Architecture 3. ProcessAnalysis Business Rules AnalysisDocumentAnalysis Risk Analysis and Management 7. Analysis of requirements involves which of the following? Usability Prototype Functional Throw-away Evolutionary 2.
Plus, there is an expectation that tools be visually appealing to boot. In the past, data visualizations were a powerful way to differentiate a software application. Their dashboards were visually stunning. Today, free visualizations seem to be everywhere. It’s all about context. End users expect more from analytics too.
We organize all of the trending information in your field so you don't have to. Join 57,000+ users and stay up to date on the latest articles your peers are reading.
You know about us, now we want to get to know you!
Let's personalize your content
Let's get even more personalized
We recognize your account from another site in our network, please click 'Send Email' below to continue with verifying your account and setting a password.


Let's personalize your content