This site uses cookies to improve your experience. To help us insure we adhere to various privacy regulations, please select your country/region of residence. If you do not select a country, we will assume you are from the United States. Select your Cookie Settings or view our Privacy Policy and Terms of Use.
Cookie Settings
Cookies and similar technologies are used on this website for proper function of the website, for tracking performance analytics and for marketing purposes. We and some of our third-party providers may use cookie data for various purposes. Please review the cookie settings below and choose your preference.
Used for the proper function of the website
Used for monitoring website traffic and interactions
Cookie Settings
Cookies and similar technologies are used on this website for proper function of the website, for tracking performance analytics and for marketing purposes. We and some of our third-party providers may use cookie data for various purposes. Please review the cookie settings below and choose your preference.
Strictly Necessary: Used for the proper function of the website
Performance/Analytics: Used for monitoring website traffic and interactions
Such API interactions should be appropriately defined and documented for a Client, requiring several API calls with some additional actions. As a product owner or business analyst, you can either (1) provide documentation for a Client describing a workflow of API calls or (2) define internal logic for API calls under BFF/APIGateway.
Unified Modeling Language (UML) stands as the cornerstone of modern software development, offering a standardized approach to modeling systems. Among its diverse set of diagrams, UML interaction diagrams hold a special place, facilitating the visualization and understanding of dynamic interactions within a system.
But also because the job of BAs focused on gathering requirements upfront, and writing heavy documents didn’t make any sense anymore. Focus on the problem Every consulted documentation suggests focusing on the problem rather than jumping to a solution. Process modeling may be used to document the “as is” process.
And some people told me UML is dead — still kicking, and useful as ever! > Keep reading… 3) Identifying and documenting business rules by Karl Wiegers My friend Jeremy visited his local blood bank’s website and made an appointment to donate blood later that day.
Sadly, many business owners never take the time to actually map and model their processes in a visual way, leading to a lack of understanding of their own business. UML diagram. As we stated earlier, a solid process model isn’t just a drawing or visual representation of your process. Data flow diagram. Gantt chart. BPMN diagram.
Visualization Tools (Tableau, Power BI): Very important when required to communicate data to the stakeholders effectively. Knowledge and Documentation/Modelling Skills: BAs tend to document and model use cases, process flows, requirements specifications, etc. Keep an eye on Collecting the Requirements and Documentation of It.
BPMN is the visual language that bridges the gap between stakeholders’ requirements and the workflow which includes actions, events, activities, artifacts, and connections between the objects. In comparison to UML Activity diagrams, it is more intelligible (at least to non-techies) and more suitable for process analysis and design.
Requirements Elicitation and Analysis : ChatGPT can be used to automatically generate requirements documentation, such as functional specifications and use cases, from stakeholder interviews or other sources of information. This process model can be represented visually using process flow diagrams such as BPMN or UML.
But just to summarize these skills: Requirement Elicitation Techniques Requirements Analysis and Modelling UML Modelling User Stories Modelling Writing Requirements Specifications (SRS, FSD etc) SELECT queries in SQL for ad-hoc reporting and testing These skills should get reflected in your resume.
As a Business Analyst, which documents have you prepared? A Business Analyst (BA) is responsible for preparing various documents as part of their role. In the SRS document, assumptions are added for risk management analysis. Hence it becomes crucial to include assumptions and constraints in the SRS document.
Did you know that using visual models can improve communication, reduce misunderstandings, and facilitate collaboration in business analysis projects? As a business analyst , creating visual models like process flow diagrams , wireframes , or entity relationship diagrams can really speed up the requirements process and provide clarity.
It also delves into risk management, quality assurance, and the critical role of project documentation. These practices not only elevate accessibility but also maintain the visual appeal of your design. How do you solve the analysis conundrum and eliminate the “documentation handoff” that plagues many teams? 14.09, 8 PM CEST.
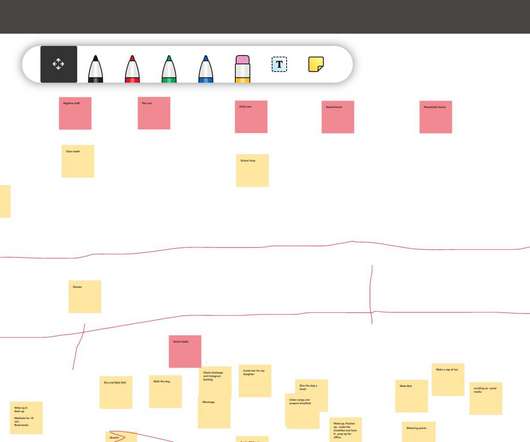
Scenario 4 – Drawing out business process models or any standard visual model. This enables you to draw out BPMN process flows, Wireframes, UML, Mind maps, Flow charts etc. Afterwards the diagrams can be exported into pictures or pdf format to add to other documentation. Tool – Draw.io. Getting started. Type draw.io
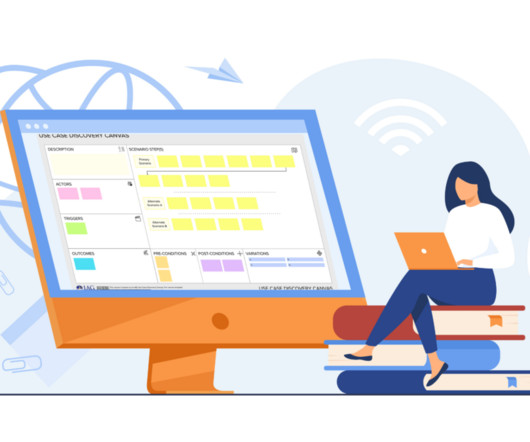
It may be that you have literally just started, have nothing, and you want to understand and model how the product will be used so that you can discover, document, and prioritize the capabilities and features (or high-level requirements, epics.) Another common approach is to use a process mapping tool based on BPMN or UML.
Whereas, in a project dealing with data flows, using an activity diagram comes handy (provided the Business Users are comfortable with UML concepts). Visual Thinking. Whenever complex ideas are being discussed, it is advisable to rely on some visual representation to have everyone on the same page. Creative Thinking.
It includes the following: Flow objects Connecting objects Swim lanes Artifacts UML (Unified Modeling Language) UML is used to develop, visualize, and document the software system as it is a modelling standard.
Activity diagrams are powerful tools in the world of software engineering, aiding in the visualization and understanding of complex processes and workflows. Explore activity diagram makers and address common questions in software engineering.
Create an Activity Diagram : In the world of systems analysis and design, activity diagrams serve as invaluable tools for visually representing workflows, processes, and activities within a system.
In the realm of software engineering, visual representations play a crucial role in understanding and communicating complex processes. One such tool is the Activity Diagram, a graphical illustration that depicts the flow of activities within a system.
Tasks may include creating prototypes, process diagrams, and documenting them in an SRS or BRD. Proficiency in visualization tools such as PowerBI and Tableau, along with knowledge of Python libraries for visual charts, is essential. In this capacity, the Business Analyst captures, details, and models requirements.
They outline the various data elements, such as customer details or transaction records, and illustrate the connections between them Therefore, a data model is not just a visual aid that brings clarity to vast and complex data but also a strategic tool that shapes the way data is configured for optimal use.
Every project that a Business Analyst works on comes with a lot of new things to adapt to – new requirements, new methodology, new business users with their unique mindsets, new type of documentation and processes to be followed. The Business Analyst must fine tune his documentation to suit the needs accordingly.
It comes with of box AI-inspired BA assistant, multiple visualization options, and strong Software capabilities such as requirement management, test case automation, and user story generation. Visual supports all agile methodologies like SCRUM, KANBAN, etc along with waterfall methodology.
We organize all of the trending information in your field so you don't have to. Join 57,000+ users and stay up to date on the latest articles your peers are reading.
You know about us, now we want to get to know you!
Let's personalize your content
Let's get even more personalized
We recognize your account from another site in our network, please click 'Send Email' below to continue with verifying your account and setting a password.


Let's personalize your content