This site uses cookies to improve your experience. To help us insure we adhere to various privacy regulations, please select your country/region of residence. If you do not select a country, we will assume you are from the United States. Select your Cookie Settings or view our Privacy Policy and Terms of Use.
Cookie Settings
Cookies and similar technologies are used on this website for proper function of the website, for tracking performance analytics and for marketing purposes. We and some of our third-party providers may use cookie data for various purposes. Please review the cookie settings below and choose your preference.
Used for the proper function of the website
Used for monitoring website traffic and interactions
Cookie Settings
Cookies and similar technologies are used on this website for proper function of the website, for tracking performance analytics and for marketing purposes. We and some of our third-party providers may use cookie data for various purposes. Please review the cookie settings below and choose your preference.
Strictly Necessary: Used for the proper function of the website
Performance/Analytics: Used for monitoring website traffic and interactions
The AI Agent: More Than Just Buzzwords There are thousands of different definitions out there, but it’s generally recognized that AI agents are designed to achieve specific outcomes by making decisions and taking actions with some degree of “autonomy” that differentiates them from simple automations.
Finally, this has led to a disconnection between data sets and analytics itself, leaving many enterprises unarmed in the face of a real crisis. Yes, they can implement BI to enable rapid, real-timedata analytics; thus, teams become able to experiment and continuously adapt to market changes caused by the pandemic.
This definitely makes the insurance industry one of the biggest consumers of machine learning technology. With machine learning platforms, which have the advantage of learning from the processing and analysis of large volumes of historical and real-timedata, even more use cases are conceivable.
Data analytics tools have made it easier to identify the long-term viability of altcoins as an investment. The simple definition of an altcoin is any digital currency that is not Bitcoin. This market data includes macroeconomic data that is correlated with traditional cryptocurrency markets.
Enter data dashboards – one of history’s best innovations in business intelligence. To help you understand this notion in full, we’re going to explore a data dashboard definition, explain the power of dashboard data, and explore a selection of data dashboard examples. To do so, you don’t have to look far.
As more companies join this green revolution, the emphasis on sustainability within data center operations is definitely going to amplify. What Makes a Data Center Sustainable? With green data centers gaining momentum, some may ask what this trend is even about.
Key differences and similarities Aspects Agentic AI Generative AI Purpose Designed for task execution and decision-making in dynamic real-world environments. Autonomy Can independently perform tasks and adapt based on real-timedata. Primarily focused on generating content such as text, images, and audio.
These situations are why unified, shared dashboards for health systems — powered by big data — have become so vital. Keeping first responders, hospital staff and dispatch professionals informed with accurate, real-timedata about the availability of medical staff and resources is essential for allocating limited supplies effectively.
One of the benefits of using AI to manage integrated business systems is that it provides real-timedata availability. Your business could be unable to enjoy real-time visibility on the general performance of your brand.
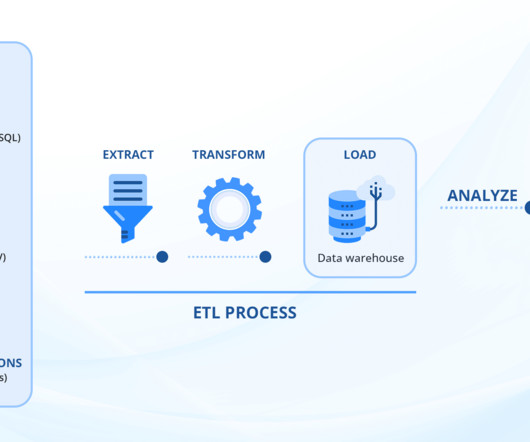
We will explain the ad hoc reporting meaning, benefits, uses in the real world, but first, let’s start with the ad hoc reporting definition. And this lies in the essence of the ad hoc reporting definition; providing quick reports for single-use, without generating complicated SQL queries. . What Is Ad Hoc Reporting?
So, how can organizations draw definite conclusions from varied sources of customer data and interpret them to help curate a positive change? All this information is hidden underneath the blanket of complex arrays of information, which when decoded, gives us the answers we are looking for.
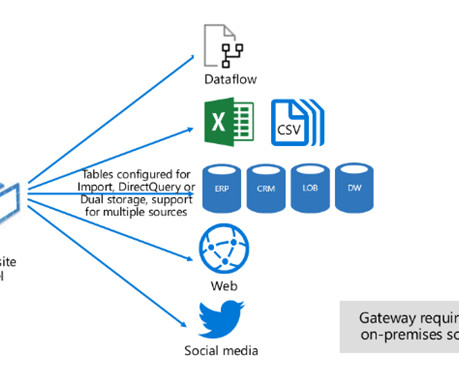
This helps teams use self-service tools to analyze data and make decisions. Here are some common use cases for creating Power BI semantic models: Centralized Data Governance : Ensures consistent definitions, relationships, and business logic across reports, promoting data accuracy and consistency across the organization.
Future Microsoft Fabric Features: Real-Time Intelligence: Support for parameters in triggers. Data Factory Enhancements: Expanded data connectivity options. Enhanced data transformations and activities. Real-timedata replication to lakehouse. Webhook integration for dynamic actions.
Success is definitely possible. It’s time to stop accepting defeat and start winning. Lack of Real-TimeData: Making decisions without real-timedata is like sailing without a compass. Real-timedata is essential for quick, informed decisions.
Integration Capabilities : These tools offer extensive integration options, connecting with a wide variety of data sources, cloud services, and applications. This flexibility ensures seamless data flow across the organization.
Scalability and Performance: Consider the tool’s scalability to handle large datasets and its performance in processing real-timedata analysis and complex queries. Cost and ROI: Calculate the total cost of ownership, including initial setup costs, licensing fees, maintenance, and training.
With realtime BI and analytics, you will move to the beat of a new digital drum, accelerating the evolution of your organization in ways you never thought possible. Here, we explore these invaluable concepts in more detail, starting with definitions, and looking at a mix of practical examples. click to enlarge**.
If you are looking for data processing at a faster pace, then you should definitely be aware of this concept. Amazon Web Services Kinesis is a cloud-based service that is ideally scalable and managed for a large amount of real-timedata processing every second. Impeccable Features of AWS Kinesis.
“Competitive organizations recognize that future-proofing the workforce is more than just data skills and tools training. For success in the future of work, organizations expand their definition of data literacy, invest in their people, and double-down on Data Culture.” —Wendy Turner-Williams, Chief Data Officer, Tableau.
To help you on your journey to data-driven success, we’ll delve into 14 dashboard design principles that will ensure you develop the most comprehensive dashboard for your personal business needs. Don’t go over the top with real-timedata. Real-timedata serves to paint a picture of a general situation or a trend.
“Competitive organizations recognize that future-proofing the workforce is more than just data skills and tools training. For success in the future of work, organizations expand their definition of data literacy, invest in their people, and double-down on Data Culture.” —Wendy Turner-Williams, Chief Data Officer, Tableau.
Another crucial factor to consider is the possibility to utilize real-timedata. Last but certainly not least in our definitive rubdown of BI benefits, we’re going to consider how BI-centric reports can assist performance management. Data that is loved tends to survive.” – Kurt Bollacker, a renowned computer scientist.
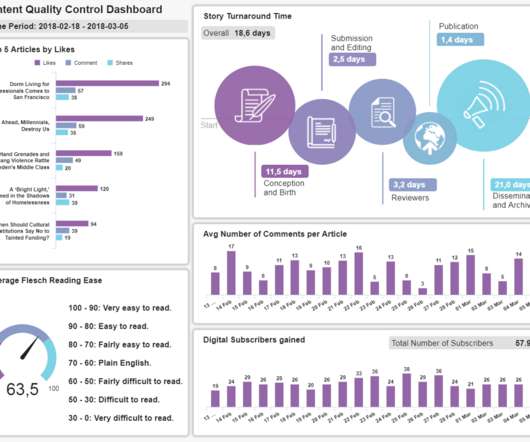
Modern content performance reports in the shape of an interactive online dashboard present an intuitive and accessible way to assess your content’s success and its ROI in real-time and in one centralized location. This is a great way to maximize your time and resources using real-timedata.
But before we unveil our definitive rundown of intelligence and business analytics books, let’s explore some facts, figures, and insights that will inspire you while steering your success in the exciting world of BI. “Data is what you need to do analytics. click for book source**. click for book source**.
Real-timeData Access – Gain real-time access to all your enterprise data regardless of its source Single Source of Truth – Global Views delivers a single set of views for each system, a single source of truth. His Oracle EBS users wanted more real-timedata, and they needed it faster than ever.
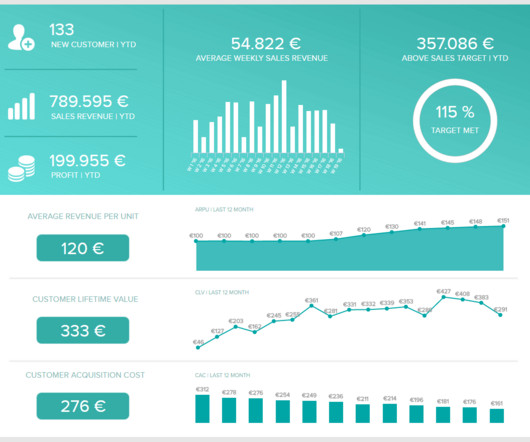
Armed with powerful visualizations and real-timedata, modern weekly summary reports enable businesses to closely monitor their performance and the progress of their strategies to extract relevant insights and optimize their processes to ensure constant growth. Let’s kick it off with the definition.
Having the ability to make real-time decisions based on trusted analytical insights that are seamless, easy to read, and user-friendly is vital to the sustained success of any modern organization. Let’s get started with some definitions! What Is White Label Business Intelligence?
The first thing that comes to mind when speaking about AWS Kinesis basics refers to its definition. It is the data analytics service offered by Amazon Web Services and is available as a fully managed and highly scalable platform for data streaming applications on AWS. Kinesis Data Streams. What is Amazon Kinesis?
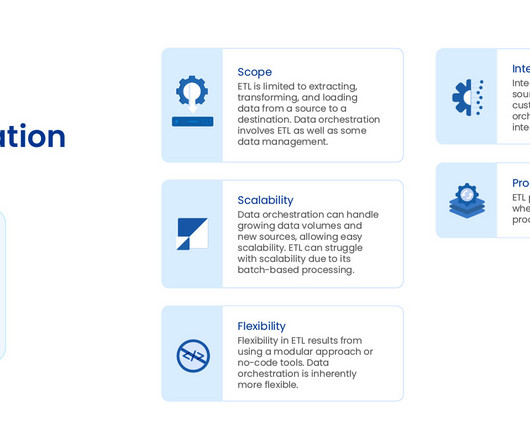
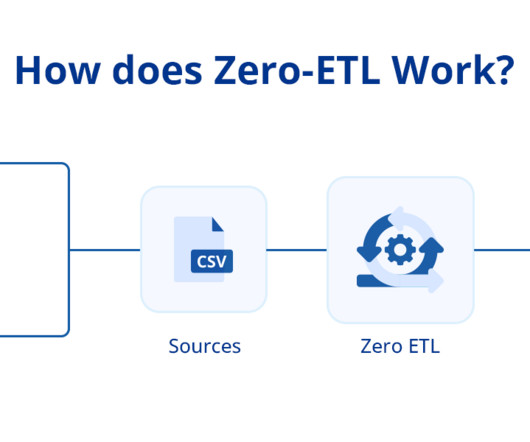
Moreover, zero-ETL also employs data virtualization and federation techniques to provide a unified view without physically moving or transforming it. So, let’s explore them in detail: Zero ETL Components Real-TimeData Replication It is a fundamental component of zero-ETL.
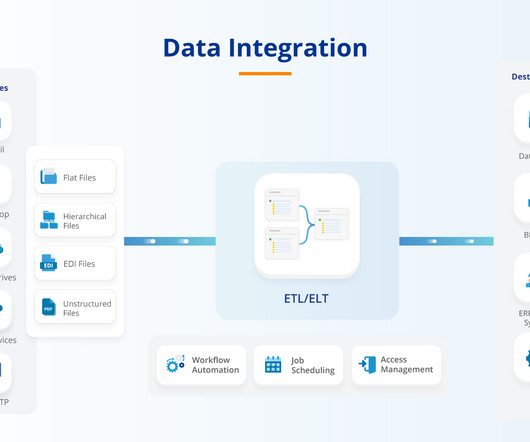
It empowers them to remain competitive and innovative in an increasingly data-centric landscape by streamlining data analytics, business intelligence (BI) , and, eventually, decision-making. But what exactly does data integration mean? The process of combining data from diverse sources into a unified and cohesive view.
It empowers them to remain competitive and innovative in an increasingly data-centric landscape by streamlining data analytics, business intelligence (BI) , and, eventually, decision-making. But what exactly does data integration mean? The process of combining data from diverse sources into a unified and cohesive view.
Aside from the fact that it is the most familiar approach, it is also definitive. With the right planning and budgeting tools , however, your organization can connect real-timedata from your existing systems (such as ERP or CRM) with forecasts and analyses built upon input from stakeholders throughout the organization.
Avoid redundant reports: You need only one tool with the state-of-the-art interactive features to quickly adapt the displayed data instead of creating 10 static PowerPoint slides. Reports use real-timedata, with implemented intelligent data alerts that enable users to completely eliminate spreadsheets and presentations.
You need to know how the audience responds, whether you need further adjustments, and how to gather accurate, real-timedata. Here we will present a social media dashboard definition, a guide on how to create one, and finalize with social media dashboard templates at the end of the article.
Thanks to the help of Datore, an implementation partner that was crucial in getting all data sources together, managers now have one dashboard with real-timedata drawn from many sources. When COVID-19 hit, TCFM was prepared to use its data for workforce planning purposes, both internally and externally for customers. “We
But before we get to our cloud computing challenges, let’s start with a simple explanation of the general characteristics and basic definitions. We mentioned the hot debate surrounding data protection in our definitive business intelligence trends guide. Exclusive Bonus Content: Download our free cloud computing tips!
With reliable data, you can make strategic moves more confidently, whether it’s optimizing supply chains, tailoring marketing efforts, or enhancing customer experiences. Data Movement Data pipelines handle various data movement scenarios, including replication, migration, and streaming.
In this article, we will present the basic definition of financial graphs, explain why you need them, and answer the most basic of questions: what graphs to include in financial analysis? Exclusive Bonus Content: Financial Charts: Get Your Free Summary. Download: A pocket-sized guide to invaluable financial graphs and charts.
Discovery workshops must define scope, epics, features, Definition Of Ready , Definition Of Done , solution architecture, and foundational solution design. This ensures there is accurate data, data controls, and make data more easily accessible and trusted. Final Thoughts on role of a BA in SDLC Lifecycle.
Before you can go ahead and check on the considerable things associated with Serverless architecture, you must get an idea of the definition of it. For adding real-timedata processing attributes to serverless architecture, one needs to consider picking up dedicated services associated with serving the purpose.
But first, let’s start with the basic definition. If you want to create a data-driven company, save countless hours in the analysis processes, and work with real-timedata, dashboards are a great way to do so. Your Chance: Want to visualize & track supply chain metrics with ease?
Keep reading to find a definition, benefits, examples, and some key best practices to generate them successfully! For instance, tools such as datapine use a mix of historical and real-timedata to generate accurate forecasts and display them in the report. What Is A Performance Report?
Let’s kick things off by considering what a company dashboard is — or, in other words, provide an enterprise dashboard definition. An enterprise dashboard, created with modern business intelligence tools , is your torch in the dark — an effective means of making sense of your data and turning it into your company’s most powerful asset.
By asking a focused question, this most visual of KPIs will give you a definitive idea of whether respondents agree, disagree, or are undecided on particular descriptions or perceptions related to your brand image. If you’re looking to present yourself and your messaging in a certain way (reliable, charming, spirited, etc.),
We organize all of the trending information in your field so you don't have to. Join 57,000+ users and stay up to date on the latest articles your peers are reading.
You know about us, now we want to get to know you!
Let's personalize your content
Let's get even more personalized
We recognize your account from another site in our network, please click 'Send Email' below to continue with verifying your account and setting a password.


Let's personalize your content