This site uses cookies to improve your experience. To help us insure we adhere to various privacy regulations, please select your country/region of residence. If you do not select a country, we will assume you are from the United States. Select your Cookie Settings or view our Privacy Policy and Terms of Use.
Cookie Settings
Cookies and similar technologies are used on this website for proper function of the website, for tracking performance analytics and for marketing purposes. We and some of our third-party providers may use cookie data for various purposes. Please review the cookie settings below and choose your preference.
Used for the proper function of the website
Used for monitoring website traffic and interactions
Cookie Settings
Cookies and similar technologies are used on this website for proper function of the website, for tracking performance analytics and for marketing purposes. We and some of our third-party providers may use cookie data for various purposes. Please review the cookie settings below and choose your preference.
Strictly Necessary: Used for the proper function of the website
Performance/Analytics: Used for monitoring website traffic and interactions
Smart DataVisualization Guides Users to Clear Data in the Right View! Features like smart datavisualization make it easy to see what is happening, where the source of a problem lies and what market opportunities may be ripe for the taking.
Smart DataVisualization Guides Users to Clear Data in the Right View! Features like smart datavisualization make it easy to see what is happening, where the source of a problem lies and what market opportunities may be ripe for the taking.
Smart DataVisualization Guides Users to Clear Data in the Right View! Features like smart datavisualization make it easy to see what is happening, where the source of a problem lies and what market opportunities may be ripe for the taking.
Smart DataVisualization Makes Your Users Smarter! What on earth is smart datavisualization? Is it a computer that actually ‘sees’ data for you and does the analysis? Get Smart DataVisualization! It is not magic!
Smart DataVisualization Makes Your Users Smarter! What on earth is smart datavisualization? Is it a computer that actually ‘sees’ data for you and does the analysis? Get Smart DataVisualization! It is not magic!
Smart DataVisualization Makes Your Users Smarter! What on earth is smart datavisualization? Is it a computer that actually ‘sees’ data for you and does the analysis? If smart datavisualization sounds like something you could use, you can explore the benefits here: Smart DataVisualization.
Smart DataVisualization Takes the Guesswork Out of Analytics! Smart datavisualization tools should include augmented data discovery with features that guide and show business users how to get the most out of data and how to display that data in a way that will make decision-making and analysis as easy as drag and drop.
Smart DataVisualization Takes the Guesswork Out of Analytics! Smart datavisualization tools should include augmented data discovery with features that guide and show business users how to get the most out of data and how to display that data in a way that will make decision-making and analysis as easy as drag and drop.
Smart DataVisualization Takes the Guesswork Out of Analytics! Smart datavisualization tools should include augmented data discovery with features that guide and show business users how to get the most out of data and how to display that data in a way that will make decision-making and analysis as easy as drag and drop.
Can Smart DataVisualization Make My Business Smarter? All the data in the world can’t help you improve your business results unless you can sift through it and see it in a way that tells a story – a story that leads you to a conclusion, helps you solve a problem or allows you to see how your business can grow, change and succeed.
Can Smart DataVisualization Make My Business Smarter? All the data in the world can’t help you improve your business results unless you can sift through it and see it in a way that tells a story – a story that leads you to a conclusion, helps you solve a problem or allows you to see how your business can grow, change and succeed.
What is Smart DataVisualization? Smart datavisualization is a crucial part of advanced analytics. Smart visualization allows business users to view and analyze data to identify a problem, clarify a root cause, identify a business opportunity, and to make confident decisions.
What is Smart DataVisualization? Smart datavisualization is a crucial part of advanced analytics. Smart visualization allows business users to view and analyze data to identify a problem, clarify a root cause, identify a business opportunity, and to make confident decisions.
What is Smart DataVisualization? Smart datavisualization is a crucial part of advanced analytics. Smart visualization allows business users to view and analyze data to identify a problem, clarify a root cause, identify a business opportunity, and to make confident decisions.
DataVisualization Tools that are Smarter Can Make Users Smarter! Think about this for a moment and imagine what this approach to analytics could do for your users and for your company. DataVisualization should tell a story. Original Post: Smart DataVisualization Makes Your Users Smarter!
DataVisualization Tools that are Smarter Can Make Users Smarter! Think about this for a moment and imagine what this approach to analytics could do for your users and for your company. DataVisualization should tell a story. Original Post: Smart DataVisualization Makes Your Users Smarter!
DataVisualization Tools that are Smarter Can Make Users Smarter! Think about this for a moment and imagine what this approach to analytics could do for your users and for your company. DataVisualization should tell a story. Original Post: Smart DataVisualization Makes Your Users Smarter!
If you are considering a Business Intelligence solution, you ought to give some consideration to the concept of Smart DataVisualization and review your prospective solution to determine its capabilities in that regard. How do users perceive and use data? How does a user identify a pattern or trend?
The real beauty of Smart DataVisualization is that it is built within an Augmented Analytics environment that is designed for the average business user without advanced technical skills.’ What is Smart DataVisualization? How Does Smart DataVisualization Work?
The real beauty of Smart DataVisualization is that it is built within an Augmented Analytics environment that is designed for the average business user without advanced technical skills.’ What is Smart DataVisualization? How Does Smart DataVisualization Work?
The real beauty of Smart DataVisualization is that it is built within an Augmented Analytics environment that is designed for the average business user without advanced technical skills.’. What is Smart DataVisualization? How Does Smart DataVisualization Work?
This enhanced data accessibility enables decision-makers to access the necessary insights quickly, leading to faster, more informed decisions. Enhanced UserExperience A well-designed layered navigation system is intuitive and user-friendly, enabling users to navigate and explore the data with ease.
If you are considering a Business Intelligence solution, you ought to give some consideration to the concept of Smart DataVisualization and review your prospective solution to determine its capabilities in that regard. How do users perceive and use data? How does a user identify a pattern or trend?
If you are considering a Business Intelligence solution, you ought to give some consideration to the concept of Smart DataVisualization and review your prospective solution to determine its capabilities in that regard. How do users perceive and use data? How does a user identify a pattern or trend?
Big data is large chunks of information that cannot be dealt with by traditional data processing software. It needs to be analyzed with premium tech tools to deduce insights germane to userexperience as well as scaling businesses. Big data analytics is finding applications in eLearning.
Digital data not only provides astute insights into critical elements of your business but if presented in an inspiring, digestible, and logical format, it can tell a tale that everyone within the organization can get behind. Datavisualization methods refer to the creation of graphical representations of information.
DataVisualization Tools Provide Crucial Decision Support! If they are to help your users achieve their goals and understand what is happening within your organization, datavisualization tools must be easy to use, with sophisticated functionality and an intuitive user interface.
DataVisualization Tools Provide Crucial Decision Support! If they are to help your users achieve their goals and understand what is happening within your organization, datavisualization tools must be easy to use, with sophisticated functionality and an intuitive user interface.
DataVisualization Tools Provide Crucial Decision Support! If they are to help your users achieve their goals and understand what is happening within your organization, datavisualization tools must be easy to use, with sophisticated functionality and an intuitive user interface.
You may alter and improve your brand’s interaction with specific customers in real time by implementing artificial intelligence and machine learning into your procedures for managing and analyzing customer data. A self-correcting userexperience powered by AI and machine learning data analysis has tremendous advantages.
Are you up on the latest analytics lingo or do you still think smart visualization is some kind of artificial eyeball? DataVisualization Tools are part of an Advanced Data Discovery approach that allow users to gather various data components and tell a story that will clarify a problem, identify an opportunity or help to make a decision.
Are you up on the latest analytics lingo or do you still think smart visualization is some kind of artificial eyeball? DataVisualization Tools are part of an Advanced Data Discovery approach that allow users to gather various data components and tell a story that will clarify a problem, identify an opportunity or help to make a decision.
Are you up on the latest analytics lingo or do you still think smart visualization is some kind of artificial eyeball? DataVisualization Tools are part of an Advanced Data Discovery approach that allow users to gather various data components and tell a story that will clarify a problem, identify an opportunity or help to make a decision.
So, why is everyone so excited about the concept of Citizen Data Scientists? Advanced Data Discovery allows business users to perform early prototyping and to test hypothesis without the skills of a data scientist. It’s simple!
So, why is everyone so excited about the concept of Citizen Data Scientists? Advanced Data Discovery allows business users to perform early prototyping and to test hypothesis without the skills of a data scientist. It’s simple!
So, why is everyone so excited about the concept of Citizen Data Scientists? Advanced Data Discovery allows business users to perform early prototyping and to test hypothesis without the skills of a data scientist. It’s simple!
In this article, we’ll explore three ways you can build a more personalized analytics experience for your customers and end users. The right datavisualization will take your custom analytics to the next level. Explore data vis libraries. First, though, let’s get on the same page about what personalization is.
From a single solution, organizations can embed cost-effective AI, interactive datavisualizations, dashboards, and reports, enhancing the value and engagement of any application RALEIGH, N.C. The process is complex, requiring a high degree of customization and extensive experience preparing and accessing data for analysis.
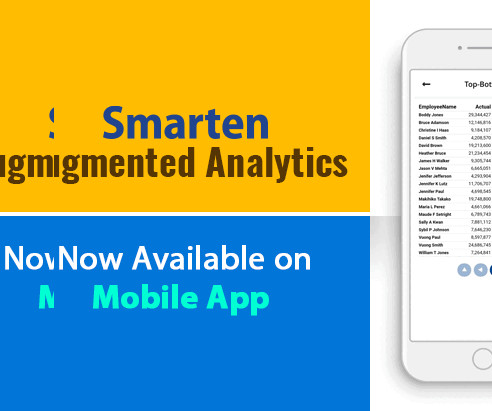
This native app has a seamless user interface for a great userexperience (UX). Smarten CEO, Kartik Patel says, “The availability of Smarten augmented analytics on a mobile device encourages user adoption and provides support for business intelligence investments and data democratization.” Installation is easy.
The data points related to users/players reside across multiple channels and platforms i.e. websites, apps, CRMs, Ad networks, and financial software. A data management strategy including business intelligence (BI) tools, datavisualization software, and a data warehouse, maybe good ideas to consider.
Rather than “telling” with a static data presentation, when you offer the ability to explore data together, it builds trust. This is the (Juicebox) Way: We made drill-down exploration the default model for the userexperience. Datavisualizations are automatically connected together, so slicing-and-dicing is de-facto.
Wells, a prominent journalist, activist, and researcher in the late 19th and early 20th centuries who pioneered data journalism. Community DataVisualization Challenges: The DataFam has launched a series of data challenges celebrating Black History Month. Data Superstar : Get ready for a datavisualization extravaganza!
Wells, a prominent journalist, activist, and researcher in the late 19th and early 20th centuries who pioneered data journalism. Community DataVisualization Challenges: The DataFam has launched a series of data challenges celebrating Black History Month. Data Superstar : Get ready for a datavisualization extravaganza!
The goal of this workshop is to enable you to bring data to life and use it to communicate a story to an audience, with a focus on simplicity and ease of interpretation. This is accomplished through a mix of datavisualization and storytelling theory, best practices, and practical application.
We organize all of the trending information in your field so you don't have to. Join 57,000+ users and stay up to date on the latest articles your peers are reading.
You know about us, now we want to get to know you!
Let's personalize your content
Let's get even more personalized
We recognize your account from another site in our network, please click 'Send Email' below to continue with verifying your account and setting a password.


Let's personalize your content