This site uses cookies to improve your experience. To help us insure we adhere to various privacy regulations, please select your country/region of residence. If you do not select a country, we will assume you are from the United States. Select your Cookie Settings or view our Privacy Policy and Terms of Use.
Cookie Settings
Cookies and similar technologies are used on this website for proper function of the website, for tracking performance analytics and for marketing purposes. We and some of our third-party providers may use cookie data for various purposes. Please review the cookie settings below and choose your preference.
Used for the proper function of the website
Used for monitoring website traffic and interactions
Cookie Settings
Cookies and similar technologies are used on this website for proper function of the website, for tracking performance analytics and for marketing purposes. We and some of our third-party providers may use cookie data for various purposes. Please review the cookie settings below and choose your preference.
Strictly Necessary: Used for the proper function of the website
Performance/Analytics: Used for monitoring website traffic and interactions
We have talked in the past about the importance of datavisualization in business. One study by Robert Horn at Stanford found that 64% of participants made a decision immediately after watching a presentation with an overview map. However, many companies are struggling to figure out how to use datavisualization effectively.
Employing an analytical system in a data-driven business can help it to discover useful trends, information, conclusions and elevated decision making. Power BI proves to be the best tool for analysis and visualization of data. Data Processing, Data Integration, and DataPresenting form the nucleus of Power BI.
The proper use of business intelligence and analytical data is what drives big brands in a competitive market. Business intelligence is simply a tool, computer software, and practice used to collect, integrate, analyze, and present raw business data that can be used to create actionable and informative business data.
Tushir Parekh, Data Analytics Manager at Harrods, presenting at UKISUG Connect 2024 in Birmingham ICC The Starting Point: A Fragmented Data Landscape Parekh set the stage by describing the state of analytics at Harrods before their transformation began in mid-2021. A lift-and-shift approach doesnt work, Parekh warned.
Data Governance. One issue that many people don’t understand is data governance. It is evident that challenges of data handling will be present in the future too. Privacy violations and unauthorized use of data may pose serious hazards to businesses. Advantage: unpaired control over data. . QlickSense.
Thomas Saueressig, head of SAP Product Engineering, and CTO Juergen Mueller presented a series of short demos helped by two “young talent” employees, Lucy Alexander and Sangeetha Jayakumar. Sustainability solutions SAP’s wide range of sustainability solutions were highlighted by Thomas and Juergen.
Since the field covers such a vast array of services, data scientists can find a ton of great opportunities in their field. Data scientists use algorithms for creating datamodels. These datamodels predict outcomes of new data. Data science is one of the highest-paid jobs of the 21st century.
You can’t talk about data analytics without talking about datamodeling. The reasons for this are simple: Before you can start analyzing data, huge datasets like data lakes must be modeled or transformed to be usable. Building the right datamodel is an important part of your data strategy.
BI Reporting Tool support business users with easy-to-use reporting for clear visualization, and flexible, customizable reports that offer agility for individual and team use. What is business intelligence? Find out here: Today’s Business Intelligence for Business Users. Contact Us now.
BI Reporting Tool support business users with easy-to-use reporting for clear visualization, and flexible, customizable reports that offer agility for individual and team use. What is business intelligence? Find out here: Today’s Business Intelligence for Business Users. Contact Us now.
BI Reporting Tool support business users with easy-to-use reporting for clear visualization, and flexible, customizable reports that offer agility for individual and team use. What is business intelligence? Find out here: Today’s Business Intelligence for Business Users. Contact Us now.
Recent studies have focused on the trends in business intelligence and augmented analytics, predicting that businesses will grow analytics within the enterprise with: Augmented Analytics to enable non-technical business users to create sophisticated datamodels.
Recent studies have focused on the trends in business intelligence and augmented analytics, predicting that businesses will grow analytics within the enterprise with: Augmented Analytics to enable non-technical business users to create sophisticated datamodels.
Recent studies have focused on the trends in business intelligence and augmented analytics, predicting that businesses will grow analytics within the enterprise with: Augmented Analytics to enable non-technical business users to create sophisticated datamodels. A BI tool is crucial for business users to monitor and presentdata.
Every aspect of analytics is powered by a datamodel. A datamodelpresents a “single source of truth” that all analytics queries are based on, from internal reports and insights embedded into applications to the data underlying AI algorithms and much more. Datamodeling organizes and transforms data.
Click to view the full interactive visualization. I was a member of Chris’ dissertation committee, having done a Stanford PhD on automatic design of graphical presentations that Chris had used in his dissertation. VizQL: A domain-specific language for visual, self-service analysis. Release v1.0
As data warehousing technologies continue to grow in demand , creat ing effective datamodels has become increasingly important. However, creating an OLTP datamodelpresents various challenges. Firstly, OLTP systems carry large volumes of transactional data every day. We suggest the latter!
As data warehousing technologies continue to grow in demand , creat ing effective datamodels has become increasingly important. However, creating an OLTP datamodelpresents various challenges. Firstly, OLTP systems carry large volumes of transactional data every day. We suggest the latter!
It then distributes this unified data throughout the enterprise, ensuring everyone, from marketing to supply chain, works with the same reliable information. Supported by data governance policies and technologies like datamodeling, MDM keeps this information trustworthy over time.
AI : The BABOK Guide defines various tasks and concepts related to business analysis, including requirements elicitation and analysis, process and datamodeling, and stakeholder communication and management. This could help save time and effort in process and datamodeling. Some suggestions include: 1.
These business users have adopted business intelligence and advanced analytical tools to gather and analyze data from varied data sources and use that analysis to identify the root cause of problems, identify opportunities, solve problems and share crucial data to support business decisions.
These business users have adopted business intelligence and advanced analytical tools to gather and analyze data from varied data sources and use that analysis to identify the root cause of problems, identify opportunities, solve problems and share crucial data to support business decisions.
These business users have adopted business intelligence and advanced analytical tools to gather and analyze data from varied data sources and use that analysis to identify the root cause of problems, identify opportunities, solve problems and share crucial data to support business decisions.
Session: From Data to Dashboard: Key Features for Analytical Success. Presenter: Darin Bergeson . Class is in session for Tableau 101: Get the introduction you need to Tableau’s most powerful analytical capabilities, from the Tableau DataModel to the new Workbook Optimizer capabilities. Theme: All things data .
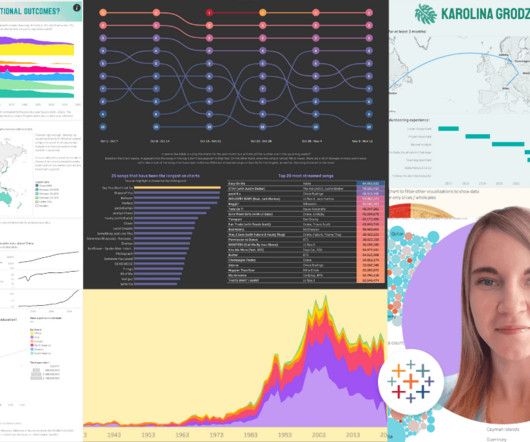
Countless hours vizzing, a standout Tableau Public profile , and a graduate degree later, Karolina reflects on her data journey and what led her to her current role as a Business Intelligence Analyst at Schneider Electric. I already had some interest in datavisualization, I just didn't know where to start.
As business requirements began to come forth by the department heads and datamodels with tons of confusing acronyms began to fly around the room, an IT developer started to diagram the reporting machinations on a large whiteboard that was said would satisfy the business needs.
This technology sprawl often creates data silos and presents challenges to ensuring that organizations can effectively enforce data governance while still providing trusted, real-time insights to the business. Tableau Pulse: Tableau Pulse metrics can be directly connected to dbt models and metrics.
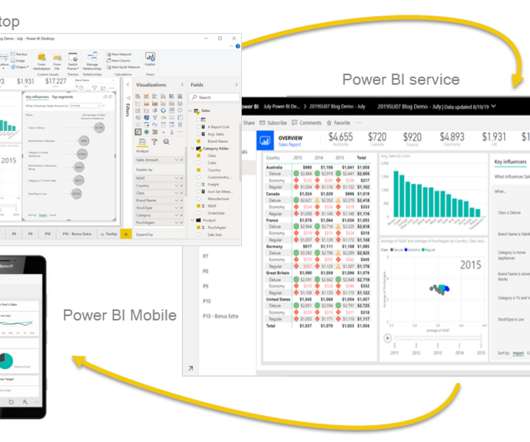
Whizlabs presents you the opportunity to excel and equip yourself with the learning of Microsoft Power BI. What Microsoft Power BI does is that it will collect all the software services, apps and web that you desire and connect every piece of data with each other. Datamodelling and visualizations. Case studies.
The provider’s analytics platform plugs into your data source, crunches your numbers, and then generates reports and dashboard datavisualizations. The right platform will give you total control over the widgets in your datavisualizations, ideally in a user-friendly UI editor (like in Sisense’s Embedded Playground ).
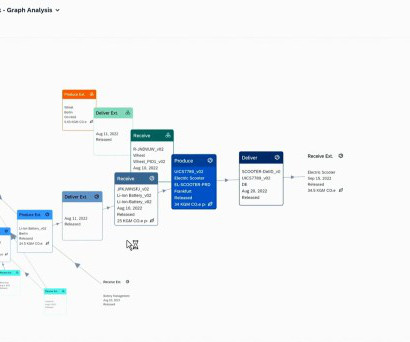
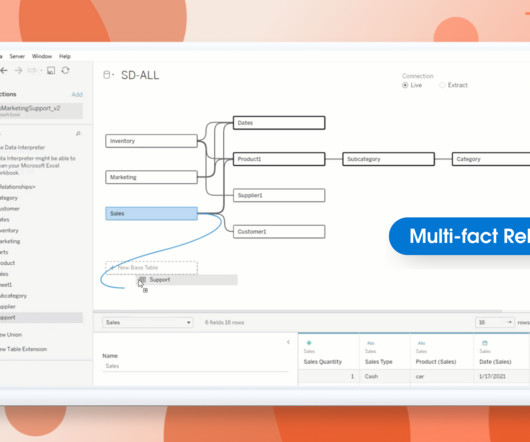
Spencer Czapiewski July 25, 2024 - 5:54pm Thomas Nhan Director, Product Management, Tableau Lari McEdward Technical Writer, Tableau Expand your datamodeling and analysis with Multi-fact Relationships, available with Tableau 2024.2. Sometimes data spans multiple base tables in different, unrelated contexts.
Session: From Data to Dashboard: Key Features for Analytical Success. Presenter: Darin Bergeson . Class is in session for Tableau 101: Get the introduction you need to Tableau’s most powerful analytical capabilities, from the Tableau DataModel to the new Workbook Optimizer capabilities. Theme: All things data .
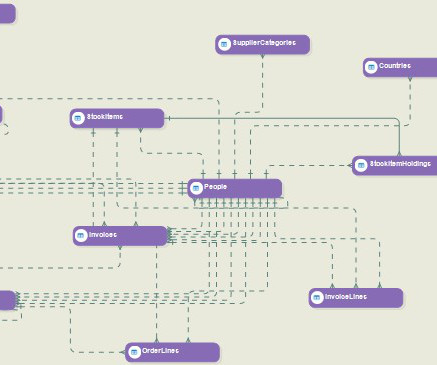
Datamodeling is the process of structuring and organizing data so that it’s readable by machines and actionable for organizations. In this article, we’ll explore the concept of datamodeling, including its importance, types , and best practices. What is a DataModel?
One result is that systems become much more intuitive: Users can take advantage of the “Simply Ask” feature to check “what are my sales next two months” and receive chatbot messages with projected visualizations and suggestions for further exploration routes. My take: The world is wider than the traditional BI tabular data.
One of the crucial success factors for advanced analytics is to ensure that your data is clean and clear and that your users have a good understanding of the source of the data so that they can put results in perspective.
One of the crucial success factors for advanced analytics is to ensure that your data is clean and clear and that your users have a good understanding of the source of the data so that they can put results in perspective.
One of the crucial success factors for advanced analytics is to ensure that your data is clean and clear and that your users have a good understanding of the source of the data so that they can put results in perspective.
Click to view the full interactive visualization. I was a member of Chris’ dissertation committee, having done a Stanford PhD on automatic design of graphical presentations that Chris had used in his dissertation. VizQL: A domain-specific language for visual, self-service analysis. Release v1.0
Yulia discusses the importance of accurate datamodeling, pointing out missing entities, vague relationships, or overly complex designs. By addressing these common pitfalls, the article provides valuable guidance for domain and datamodeling. Why is this? Is it possible that sometimes we don’t make enough of an impact?
We are proud to present you a platform which will help you have an actionable insight on data. Power BI, built on the foundation of Microsoft Excel, is the umbrella term for a collection of cloud-based apps and services that enable businesses to capture, process, and analyse data from a variety of sources using a simple user interface.
In this post, we’ll explore why embedded analytics are so vital and new ways to let users actually talk to their data. Simply delivering predetermined visualizations and dashboards embedded within your application, while relevant and useful, has become basic table stakes. Building beyond basic embedding. It’s not new anymore!
Building an effective dashboard according to best practices for dashboard design is the culmination of a comprehensive BI process that would usually include gathering requirements, defining KPIs, and creating a datamodel. This is where the visual layout of a dashboard plays a crucial role. The 5 Second Rule.
Organizations that can effectively leverage data as a strategic asset will inevitably build a competitive advantage and outperform their peers over the long term. In order to achieve that, though, business managers must bring order to the chaotic landscape of multiple data sources and datamodels.
And rather than answering prescriptive questions — something that BI teams excel at — data teams are able to model future events and understand how changing a past variable could have affected the present. So why do data teams reach out to their business intelligence colleagues to implement a new BI and analytics tool?
There is not a clear line between business intelligence and analytics, but they are extremely connected and interlaced in their approach towards resolving business issues, providing insights on past and presentdata, and defining future decisions. What Is Business Intelligence And Analytics?
We organize all of the trending information in your field so you don't have to. Join 57,000+ users and stay up to date on the latest articles your peers are reading.
You know about us, now we want to get to know you!
Let's personalize your content
Let's get even more personalized
We recognize your account from another site in our network, please click 'Send Email' below to continue with verifying your account and setting a password.


Let's personalize your content