This site uses cookies to improve your experience. To help us insure we adhere to various privacy regulations, please select your country/region of residence. If you do not select a country, we will assume you are from the United States. Select your Cookie Settings or view our Privacy Policy and Terms of Use.
Cookie Settings
Cookies and similar technologies are used on this website for proper function of the website, for tracking performance analytics and for marketing purposes. We and some of our third-party providers may use cookie data for various purposes. Please review the cookie settings below and choose your preference.
Used for the proper function of the website
Used for monitoring website traffic and interactions
Cookie Settings
Cookies and similar technologies are used on this website for proper function of the website, for tracking performance analytics and for marketing purposes. We and some of our third-party providers may use cookie data for various purposes. Please review the cookie settings below and choose your preference.
Strictly Necessary: Used for the proper function of the website
Performance/Analytics: Used for monitoring website traffic and interactions
In future special services, specialists and mechanisms will ensure that data comes from valid sources, gets used for intended purposes, accessed by authorized employees, and deleted when not needed anymore. The growing number of business intelligence innovations means that the amount of personnel relying on data will grow.
Standardize Tools: Adopt SAP Analytics Cloud (SAC) for visualization and self-service capabilities. Backlog of Reports: Migrating legacy reports to SAC consumed significant resources, slowing innovation. Empower Business Teams: Allow business users to focus on insights and decision-making instead of building reports.
You can’t talk about data analytics without talking about datamodeling. The reasons for this are simple: Before you can start analyzing data, huge datasets like data lakes must be modeled or transformed to be usable. Building the right datamodel is an important part of your data strategy.
Data Lakes are among the most complex and sophisticated data storage and processing facilities we have available to us today as human beings. Analytics Magazine notes that data lakes are among the most useful tools that an enterprise may have at its disposal when aiming to compete with competitors via innovation.
In the current wave of data, to stay ahead in the curve, a business needs to master those tools that businesses use to make smart decisions. Enter Power BI-a powerful, dynamic tool dramatically changing the way companies analyze and see their data. It features rich visualizations with highly interactive dashboards. Lakhs to ₹5.5
Your boundless creativity and innovative ideas have been a constant source of inspiration, driving us to develop products that enhance and enrich your experience. Its your feedback and collaboration that help us push the boundaries of whats possible in datavisualization and analytics.
Tableau and Google Cloud are partnering to help modernize your data and analytics infrastructure and unlock your data’s full value. Google's Cloud Platform is the enterprise solution of choice for many organizations with large and complex data problems. With Tableau, any user can visually explore that data in real time.
Artificial Intelligence impersonates human intelligence using various algorithms to collect data and improve performance with data compliance over some time. Data Enrichment/Data Warehouse Layer. Data Analytics Layer. DataVisualization Layer.
The provider’s analytics platform plugs into your data source, crunches your numbers, and then generates reports and dashboard datavisualizations. The right platform will give you total control over the widgets in your datavisualizations, ideally in a user-friendly UI editor (like in Sisense’s Embedded Playground ).
One result is that systems become much more intuitive: Users can take advantage of the “Simply Ask” feature to check “what are my sales next two months” and receive chatbot messages with projected visualizations and suggestions for further exploration routes. My take: The world is wider than the traditional BI tabular data.
Tableau and Google Cloud are partnering to help modernize your data and analytics infrastructure and unlock your data’s full value. Google's Cloud Platform is the enterprise solution of choice for many organizations with large and complex data problems. With Tableau, any user can visually explore that data in real time.
Organizations that can effectively leverage data as a strategic asset will inevitably build a competitive advantage and outperform their peers over the long term. In order to achieve that, though, business managers must bring order to the chaotic landscape of multiple data sources and datamodels.
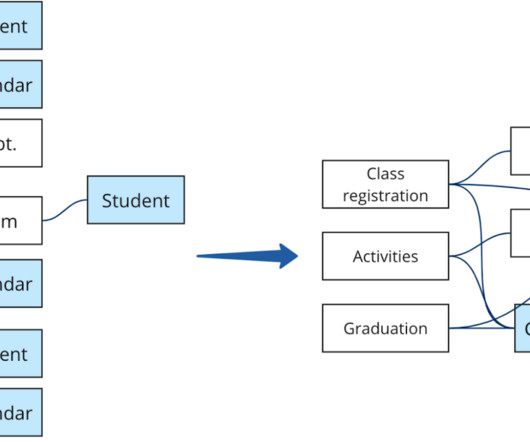
Datamodeling is the process of structuring and organizing data so that it’s readable by machines and actionable for organizations. In this article, we’ll explore the concept of datamodeling, including its importance, types , and best practices. What is a DataModel?
Let’s look back at how our innovations from 2022 create efficiencies and boost your bottom line. Automate the analysis, build, and communication of insights with Data Stories. Ask Data empowers everyone in the organization to build visualizations using natural language queries. Simplify Tableau Prep connections.
Let’s look back at how our innovations from 2022 create efficiencies and boost your bottom line. Automate the analysis, build, and communication of insights with Data Stories. Ask Data empowers everyone in the organization to build visualizations using natural language queries. Simplify Tableau Prep connections.
In the case of a stock trading AI, for example, product managers are now aware that the data required for the AI algorithm must include human emotion training data for sentiment analysis. It follows then that data scientists are suddenly integral to building embedded AI components.
you already have a data strategy in place, then it is easier to identify and analyze where AI would be the most useful for your business.Analytics Insight has an informative blog on the wide range of use-cases of AI in prominent industries. AI helps break down consumer data into key insights. Applications of AI. AI in Marketing.
Power BI, built on the foundation of Microsoft Excel, is the umbrella term for a collection of cloud-based apps and services that enable businesses to capture, process, and analyse data from a variety of sources using a simple user interface. Power View is a tool that specializes in the visualization of your data.
These increasingly difficult questions require sophisticated datamodels, connected to an increasing number of data sources, in order to produce meaningful answers. Therein lies the power of your data team: Armed with know-how, they connect with the end user teams (internal users, product teams embedding insights, etc.)
Analytics for everyone: Explore new and existing innovations and smart analytical experiences, like predictive analytics, Tableau Business Science , and Tableau for the Enterprise , that make it easier for everyone in an organization to use data and analytics. . Here’s what to expect from each theme: . Ashley Howard Neville , Sr.
At Sisense, we see the rise of AI and a multicloud world accelerating the next wave of digital transformation, helping organizations reimagine their business and drive innovation, adoption, and value from data in the digital era. Thriving in a changing world: AI and multiple clouds. Unleash the power of advanced analytics.
Ensuring that your organization has the right business intelligence and analytics tools to drive this innovation is key. As we have previously posted, the BI group is often the department that approaches the data teams for access to an analytics solution. Build a bridge to the BI team by bringing them into the process.
Sisense News is your home for corporate announcements, new Sisense features, product innovation, and everything we roll out to empower our users to get the most out of their data. Recent and saved searches can be reused through a single click, and answers can be quickly applied to modify a visualization through an intuitive UI.
For example, building visualizations from a search query is great. Recommended modeling when adding new disparate dataData deduplication and cleansing for those times when data isn’t perfect – and by that I mean always. Smart field and widget suggestions to assist in navigating complex datamodels.
Its user-friendly interface simplifies data science processes, enabling effortless visualization and configuration of models. The key features include: Analytics Workbench: The Analytics Workbench allows you to perform descriptive, diagnostic, and predictive analysis using a visually powered designer with interactive features.
Sisense News is your home for corporate announcements, new Sisense features, product innovation, and everything we roll out to empower our users to get the most out of their data. Today’s organizations are more data-driven than ever. Additional capabilities.
Low-code platforms typically use drag-and-drop features, automatic code generation, business process maps, and other visual tools to deliver an agile development environment without requiring the time or complexity of traditional coding methods. Some of the other reasons for the popularity of the low-code model include – Low Cost.
Our innovations are people-centric by design, helping unlock creativity to solve tangible challenges with data. In addition to technology, Tableau is invested in helping organizations build their Data Culture, so they can be successful with analytics at scale. People love Tableau because it’s powerful, yet intuitive.
There are primarily two underlying techniques that can be leveraged for AML initiatives- Exploratory Data Analysis and Predictive analytics. Exploratory Data Analysis (EDA) EDA is used to analyze data and summarize their main properties and characteristics using visual techniques.
There are primarily two underlying techniques that can be leveraged for AML initiatives- Exploratory Data Analysis and Predictive analytics. Exploratory Data Analysis (EDA). EDA is used to analyze data and summarize their main properties and characteristics using visual techniques.
Some of his must read write-ups are 5 Pillars of Innovation , The 20/20 Vision of Cloud , and Making Smart Cloud Choices in Uncertain Times. He is a driven executive and a military veteran who helps in casting innovative digital transformation for companies and measurably builds on it. Follow Sven Ringling on Twitter and LinkedIn.
During Mark’s tenure, he has helmed Skullcandy’s digital transformation and his team has successfully increased online revenue and presence in the digital ecosystems, evolved into a world class customer service organization, and enabled growth with innovative systems solutions. Full circle data experience: achieved. Lessons Learned.
Yulia discusses the importance of accurate datamodeling, pointing out missing entities, vague relationships, or overly complex designs. By addressing these common pitfalls, the article provides valuable guidance for domain and datamodeling. 14.09, 8 PM CEST. Essential Requirements Practices.
Analytics for everyone: Explore new and existing innovations and smart analytical experiences, like predictive analytics, Tableau Business Science , and Tableau for the Enterprise , that make it easier for everyone in an organization to use data and analytics. . Here’s what to expect from each theme: . Ashley Howard Neville , Sr.
Sophisticated technical talent who are querying data and building models with languages like SQL, R, and Python need a solution that will empower them to dive deep. Platforms like Sisense enable these teams to quickly explore data through code, visualize the results, or convert them to models written back to AWS Redshift or Snowflake.
To simplify things, you can think of back-end BI skills as more technical in nature and related to building BI platforms, like online datavisualization tools. Front-end analytical and business intelligence skills are geared more towards presenting and communicating data to others. b) If You’re Already In The Workforce.
The correct answer is: everybody has an opinion, but nobody knows, and you shouldn’t care.” – Timo Elliot, Innovation Evangelist at SAP. Well, what if you do care about the difference between business intelligence and data analytics? “What’s the difference between Business Analytics and Business Intelligence?
Process Modeling: Unveiling the Flow Imagine a roadmap outlining your business processes, visualizing workflows, decision points, and interactions. Process modeling , this visual representation, empowers stakeholders to identify inefficiencies, streamline workflows, and maximize resource utilization.
Statistical Analysis : Using statistics to interpret data and identify trends. Predictive Analytics : Employing models to forecast future trends based on historical data. DataVisualization : Presenting datavisually to make the analysis understandable to stakeholders.
Business Analytics Professional Data has always been central when it comes to business analytics professionals, Business analytics professionals focus on analyzing data to derive insights and support data-driven decision-making. Arguably, there is a debate about which language suits data analysis better.
As with any new innovation, we also understand that there are still many questions you have about the new platform, what it means for your organizations, the community, and careers. With a deep integration to Data Cloud, Tableau Next has the most modern data capabilities from zero-copy data ingestion to prep, data management, and semantics.
As with any new innovation, we also understand that there are still many questions you have about the new platform, what it means for your organizations, the community, and careers. Tableau Einstein is also deeply integrated with Agentforce and provides access to all of the latest no-code/low-code AI advancements and innovations.
Low code platforms do this by offering a robust visual development environment where developers can define the user interface using drag and drop functionality, adding actions, animations, and much more. It allows developers to define business logic, workflow processes, datamodel, and UIs for mobile and web apps.
The inability, however, to get new insights from known KPIs and uncover new relationships from data is one of the many reasons we believe the adoption of analytics has not gained further momentum. We are proud of how our customers have started to take this journey with us, and value your continued investment in Sisense.
We organize all of the trending information in your field so you don't have to. Join 57,000+ users and stay up to date on the latest articles your peers are reading.
You know about us, now we want to get to know you!
Let's personalize your content
Let's get even more personalized
We recognize your account from another site in our network, please click 'Send Email' below to continue with verifying your account and setting a password.


Let's personalize your content