This site uses cookies to improve your experience. To help us insure we adhere to various privacy regulations, please select your country/region of residence. If you do not select a country, we will assume you are from the United States. Select your Cookie Settings or view our Privacy Policy and Terms of Use.
Cookie Settings
Cookies and similar technologies are used on this website for proper function of the website, for tracking performance analytics and for marketing purposes. We and some of our third-party providers may use cookie data for various purposes. Please review the cookie settings below and choose your preference.
Used for the proper function of the website
Used for monitoring website traffic and interactions
Cookie Settings
Cookies and similar technologies are used on this website for proper function of the website, for tracking performance analytics and for marketing purposes. We and some of our third-party providers may use cookie data for various purposes. Please review the cookie settings below and choose your preference.
Strictly Necessary: Used for the proper function of the website
Performance/Analytics: Used for monitoring website traffic and interactions
Imagine you are ready to dive deep into a new project, but amidst the sea of information and tasks, you find yourself at a crossroads: What documents should you create to capture those crucial requirements? The path to success lies in understanding the power of documentation. It defines the scope of the project.
AI : The BABOK Guide defines various tasks and concepts related to business analysis, including requirements elicitation and analysis, process and datamodeling, and stakeholder communication and management. This could help save time and effort in process and datamodeling. Some suggestions include: 1.
Tableau and Google Cloud are partnering to help modernize your data and analytics infrastructure and unlock your data’s full value. Google's Cloud Platform is the enterprise solution of choice for many organizations with large and complex data problems. With Tableau, any user can visually explore that data in real time.
It also delves into risk management, quality assurance, and the critical role of project documentation. Yulia discusses the importance of accurate datamodeling, pointing out missing entities, vague relationships, or overly complex designs. 14.09, 8 PM CEST. Essential Requirements Practices.
Datamodeling is the process of structuring and organizing data so that it’s readable by machines and actionable for organizations. In this article, we’ll explore the concept of datamodeling, including its importance, types , and best practices. What is a DataModel?
Exploratory Data Analysis (EDA) EDA is used to analyze data and summarize their main properties and characteristics using visual techniques. In this case, once a customer’s documents are scanned and uploaded, the necessary data is extracted from the key documents and then converted to machine-readable form.
EDA is used to analyze data and summarize their main properties and characteristics using visual techniques. Widely used to discover trends, patterns, check assumptions and spot anomalies or outliers, EDA involves a variety of techniques including statistical analysis, and machine learning to gain a better understanding of data.
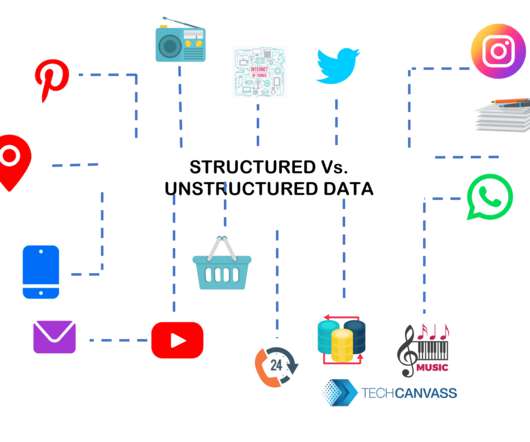
They hold structured data from relational databases (rows and columns), semi-structured data ( CSV , logs, XML , JSON ), unstructured data (emails, documents, PDFs), and binary data (images, audio , video). Sisense provides instant access to your cloud data warehouses. Connect tables.
One result is that systems become much more intuitive: Users can take advantage of the “Simply Ask” feature to check “what are my sales next two months” and receive chatbot messages with projected visualizations and suggestions for further exploration routes. My take: The world is wider than the traditional BI tabular data.
The provider’s analytics platform plugs into your data source, crunches your numbers, and then generates reports and dashboard datavisualizations. The right platform will give you total control over the widgets in your datavisualizations, ideally in a user-friendly UI editor (like in Sisense’s Embedded Playground ).
Low-code platforms typically use drag-and-drop features, automatic code generation, business process maps, and other visual tools to deliver an agile development environment without requiring the time or complexity of traditional coding methods. Visual based design. Pros: Offers a compelling visual app designer.
Model Techniques from BABOK Guide v3 From IIBA’sBABOK Guide v3 a business process model is defined as: “…a visual representation of the sequential flow and control logic of a set of related activities or actions.” Models are a means to visualize the steps of a complex or multi-stage process.
Sadly, many business owners never take the time to actually map and model their processes in a visual way, leading to a lack of understanding of their own business. We’ll discuss why business process modeling is essential for modern organizations, as well as how to implement it, starting today. BPMN diagram.
Experiment with a new visualmodel to clarify a complex concept. Consider a new type of requirements document to address a currently unmet need, such as a business process model, scope statement, or use case. Goals in this area could include updating a template , documenting an as is process , or creating a tip sheet.
Tableau and Google Cloud are partnering to help modernize your data and analytics infrastructure and unlock your data’s full value. Google's Cloud Platform is the enterprise solution of choice for many organizations with large and complex data problems. With Tableau, any user can visually explore that data in real time.
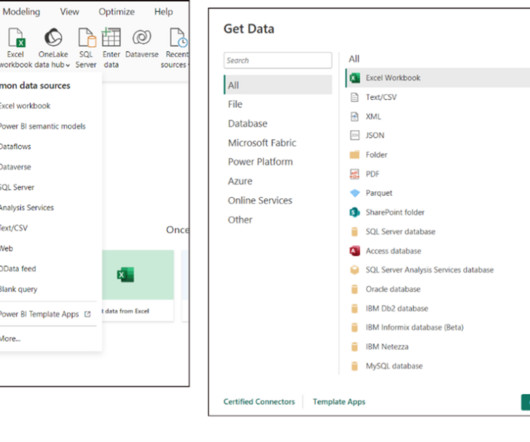
Power BI is a datavisualization and data analytics platform moreover it can be a services BI tool developed by Microsoft under the power platform. The integration of these technologies turns different sources of data into deep insights and static and interactive visualization. It has more than 300 data connectors.
Tableau lets you visualize and explore all of your data without having to write code or premeditate your vizzes and dashboards. We also reached some incredible milestones with Tableau Prep, our easy-to-use, visual, self-service data prep product. Read the 2021 report for Gartner analysis.
A dashboard is a collection of multiple visualizations in data analytics terms that provide an overall picture of the analysis. Also, see datavisualization. Data Analytics. Data analytics is the science of examining raw data to determine valuable insights and draw conclusions for creating better business outcomes.
You likely already have some form of scheduled reports, are drilling down into your data, discovering what is in your data, and may even be visualizing to some extent. 2 Plan your objectives (and map the supporting data). 3 Define how the data will be shared (and how it will be distributed).
Visually representation of AI mimics the human world but does not understand it. Prompt: “Computer on the desk, data diagrams on the screen” — Source: Bing AI image generator. Companies also call it an IT data analyst or Business Intelligence analyst. AGI’s capability is equal to human intelligence. AGI hasn’t been achieved yet.
To make your job easier, create a document that specifies your project’s inputs and deliverables, and then double-check your resource and format criteria related to the description of your predictive analytics project. Overfitting your data refers to creating a complicated datamodel that fits your limited set of data.
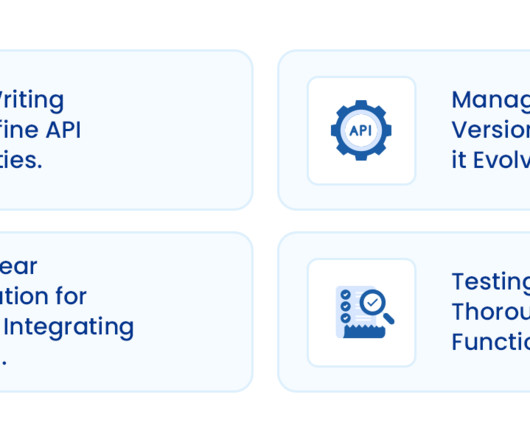
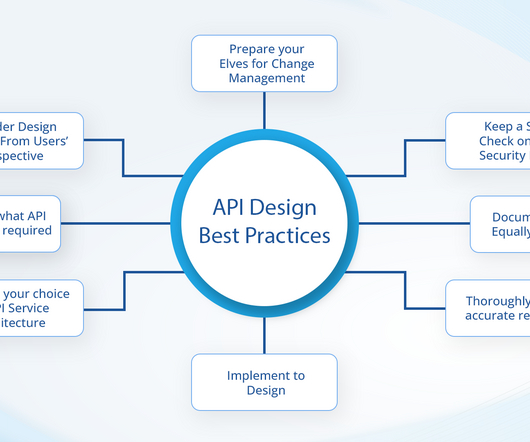
Enhanced Documentation: Good API documentation is essential for other API developers. API design tools often include features that autogenerate documentation based on the design, making it easier for other developers to understand and use the API. A tool should be intuitive and easy to use, even for those new to API design.
These tools typically offer features for: Designing and building APIs: Define API endpoints, datamodels, request/response structures, and authentication mechanisms. Documentation generation: Automatically generate clear and comprehensive API documentation for developers integrating with API.
update is the cutting-edge AI capabilities, enabling data extraction at unprecedented speeds. With just a few clicks, you can effortlessly handle unstructured documents. This new AI feature accelerates and simplifies document processing. Specify the data layout and the fields you want to extract.
How Astera Data Warehouse Builder Uses Amazon Redshift Astera Data Warehouse Builder takes full advantage of the power and scalability of Amazon Redshift, allowing organizations to access and analyze data in ways that are not usually possible with traditional data warehouses.
Data Governance Data lineage, data provenance , and data governance are all crucial concepts in data management, but they address different aspects of handling data. Data Provenance captures metadata describing the origin and history of data, including inputs, entities, systems, and processes involved.
When you use multiple techniques, particularly powerful analytical and visualmodels, you will find that you naturally see gaps that others gloss over and identify the downstream impact of a change or new solution. Datamodeling is critical on all kinds of projects, but especially data migration and system integration projects.
Creating a Business Data Diagram. I found the exercise of creating a Data Flow Diagram for a block walk/canvass so interesting that I decided to play with the same use case to create another datamodel, the Business Data Diagram (BDD). The BDD is one of the most important and useful models we use.
I found the exercise of creating a Data Flow Diagram for a block walk/canvass so interesting that I decided to play with the same use case to create another datamodel, the Business Data Diagram (BDD). The BDD is one of the most important and useful models we use. Next Step - Requirements!
This has enabled them to solve data problems much faster while reducing overall costs in custom development work, hiring, and more. Building custom pipelines, setting up web data connectors, or considering iPaas solutions—things you would need to set up data access in Tableau—can take months. See documentation here.
Models allow us to better understand the stakeholder needs and provide a venue for any project professional to elicit and capture solution requirements. They reduce ambiguity by providing a visual for stakeholders to see and effectively translate requirements in a way the stakeholders understand and the development team is able to implement.
Process Modeling: Unveiling the Flow Imagine a roadmap outlining your business processes, visualizing workflows, decision points, and interactions. Process modeling , this visual representation, empowers stakeholders to identify inefficiencies, streamline workflows, and maximize resource utilization.
We generate enormous amounts of a variety of data every day. Businesses obtain valuable insights by analyzing various data like pdf documents, customer reviews, audio analysis, webcam video analysis, voice processing, fraud detection, etc. Unstructured Data. The list can cover pages and pages! Key Differences.
If so, visualmodels such as Business Objectives Model and high-level flows are an invaluable way of distilling the information to the high points while avoiding losing the audience in a sea of details. Then the facilitator would be remiss not to have slides or documentation that cover the technical landscape.
As quality issues are often highlighted with the use of dashboard software , the change manager plays an important role in the visualization of data quality. Business/Data Analyst: The business analyst is all about the “meat and potatoes” of the business. 2 – Data profiling.
Statistical Analysis : Using statistics to interpret data and identify trends. Predictive Analytics : Employing models to forecast future trends based on historical data. DataVisualization : Presenting datavisually to make the analysis understandable to stakeholders.
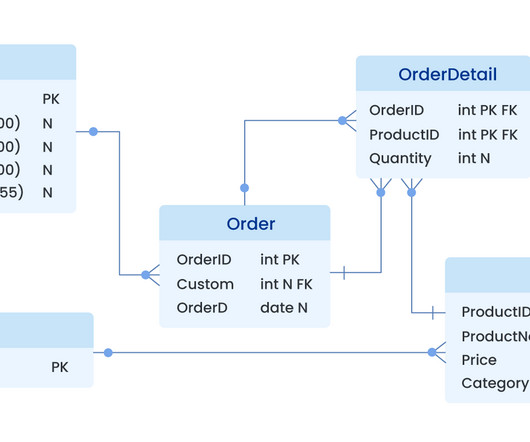
A database schema, or DB schema, is an abstract design representing how your data is stored in a database. They’re the blueprint that defines how a database stores and organizes data, its components’ relationships, and its response to queries. Database schemas are vital for the datamodeling process.
These systems can be part of the company’s internal workings or external players, each with its own unique datamodels and formats. ETL (Extract, Transform, Load) process : The ETL process extracts data from source systems to transform it into a standardized and consistent format, and then delivers it to the data warehouse.
These systems can be part of the company’s internal workings or external players, each with its own unique datamodels and formats. ETL (Extract, Transform, Load) process : The ETL process extracts data from source systems to transform it into a standardized and consistent format, and then delivers it to the data warehouse.
What could be the reasons: A) Selection of incorrect elicitation techniques B) Lack of reviews C) Lack of existing documentation A and C All the three B and C A and B In the Requirement Elicitation phase, just before interacting with a highly influential Stakeholder, the Business Analyst has a dilemma on the place of interview.
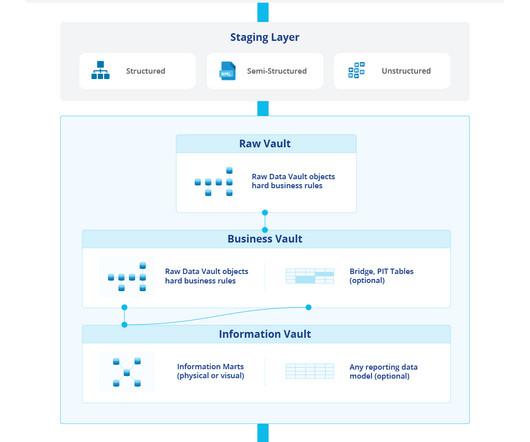
Data vault is an emerging technology that enables transparent, agile, and flexible data architectures, making data-driven organizations always ready for evolving business needs. What is a Data Vault? A data vault is a datamodeling technique that enables you to build data warehouses for enterprise-scale analytics.
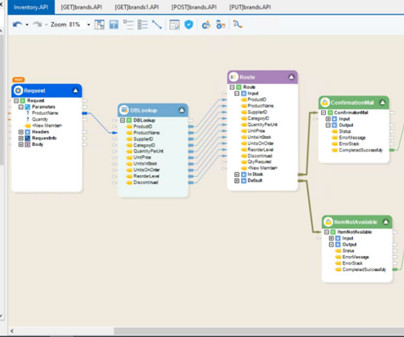
Rest APIs are used for resource-based data APIs that are easily understood for common platform usage. These resources are backed by a datamodel that helps derive relationships between various API resources exposed to a user. GraphQL: used for data APIs with more flexibility to query nested resource data in a single request.
At the heart of the Power Platform is Microsoft’s Common DataModel (Service). The CDS is a data storage service in Microsoft 365. Do things like synchronizing files, get notifications, collect data, approve documents, etc. From those datasets, complex analysis and data manipulation occurs.
I’ll be sharing specific techniques for business process analysis , use cases , and datamodeling , as well as success stories from ACBAs. We’ve got document management tools. >> Click here to download the use case template << COTS Requirements: DataModeling. Data is everywhere these days.
We organize all of the trending information in your field so you don't have to. Join 57,000+ users and stay up to date on the latest articles your peers are reading.
You know about us, now we want to get to know you!
Let's personalize your content
Let's get even more personalized
We recognize your account from another site in our network, please click 'Send Email' below to continue with verifying your account and setting a password.


Let's personalize your content