This site uses cookies to improve your experience. To help us insure we adhere to various privacy regulations, please select your country/region of residence. If you do not select a country, we will assume you are from the United States. Select your Cookie Settings or view our Privacy Policy and Terms of Use.
Cookie Settings
Cookies and similar technologies are used on this website for proper function of the website, for tracking performance analytics and for marketing purposes. We and some of our third-party providers may use cookie data for various purposes. Please review the cookie settings below and choose your preference.
Used for the proper function of the website
Used for monitoring website traffic and interactions
Cookie Settings
Cookies and similar technologies are used on this website for proper function of the website, for tracking performance analytics and for marketing purposes. We and some of our third-party providers may use cookie data for various purposes. Please review the cookie settings below and choose your preference.
Strictly Necessary: Used for the proper function of the website
Performance/Analytics: Used for monitoring website traffic and interactions
Well, it is – to the ones that are 100% familiar with it – and it involves the use of various data sources, including internal data from company databases, as well as external data, to generate insights, identify trends, and support strategic planning. In the 1990s, OLAP tools allowed multidimensional data analysis.
In today’s digital landscape, datamanagement has become an essential component for business success. Many organizations recognize the importance of big data analytics, with 72% of them stating that it’s “very important” or “quite important” to accomplish business goals. Real-timeData Integration Every day, about 2.5
Once companies gain regular insights into their KPIs, they see deeper into their data and generate actionable insight. The traditional types of reporting don’t meet the requirements of today’s datamanagement nor can they produce efficiency like an interactive dashboard where sets of data are presented in a complementary way.
Datavisualization software Tableau even offers drag-and-drop features that make it incredibly simple for anyone to get started. SAS The SAS Institute for DataManagement in North Carolina created the statistical software suite (SAS) for datamanagement, advanced analytics, and predictive analytics.
An interactive dashboard is a datamanagement tool that tracks, analyzes, monitors, and visually displays key business metrics while allowing users to interact with data, enabling them to make well-informed, data-driven, and healthy business decisions. Say you want to visualize your revenue data by country.
Ad hoc reporting, also known as one-time ad hoc reports, helps its users to answer critical business questions immediately by creating an autonomous report, without the need to wait for standard analysis with the help of real-timedata and dynamic dashboards. Datavisualization capabilities.
In our data-driven digital age, ‘business intelligent’ organizations with the ability to collate, organize, and leverage the insights that are most valuable to their ongoing commercial goals are the ones that are destined to thrive in the long-term. That said, in a time wherein less than two years, around 1.7
Financial efficiency: One of the key benefits of big data in supply chain and logistics management is the reduction of unnecessary costs. Using the right dashboard and datavisualizations, it’s possible to hone in on any trends or patterns that uncover inefficiencies within your processes. Now’s the time to strike.
This huge project will provide real-timedata to flow through dashboards to better understand the data that could help solve the crisis. In the US, an interactive data platform allows people to use a dashboard to analyze and monitor US hospital capacity and isolate geographic areas of risk.
And we’re not just talking about marketing, but all your business’ bits and pieces should embrace the power of modern data analysis and utilize a professional dashboard creator that will enhance your datamanagement processes. Still unsure? What Is A Performance Dashboard In Business? Intelligent reporting. Sales Target.
In fact, experts say that companies in the US lose more than $600 billion a year in problems related to keeping their data current and useful. Explore our 14-days free trial and benefit from real-timedata access! Explore our 14-days free trial and benefit from real-timedata access!
Summing up the product of all this work, the data science team developed a web-based user interface that forecasts patient loads and helps in planning resource allocation by utilizing online datavisualization that reaches the goal of improving the overall patients’ care. 2) Electronic Health Records (EHRs).
Taking all these into consideration, it is impossible to ignore the benefits that your business can endure from implementing BI tools into their datamanagement process. Thanks to real-timedata provided by these solutions, you can spot potential issues and tackle them before they become bigger crises.
The platform leverages a high-performing ETL engine for efficient data movement and transformation, including mapping, cleansing, and enrichment. Key Features: AI-Driven DataManagement : Streamlines data extraction, preparation, and data processing through AI and automated workflows. No SQL CLI.
A planned BI strategy will point your business in the right direction to meet its goals by making strategic decisions based on real-timedata. Save time and money: Thinking carefully about a BI roadmap will not only help you make better strategic decisions but will also save your business time and money.
retailers are investing heavily in cross-channel datamanagement systems and aggressively recruiting the employees they need to implement them. Domo helps retailers tap into data like never before. As a result, U.K. Want to know more about how Domo has helped some of the biggest brands?
Skyvia Skyvia is a cloud-based integration platform that offers solutions to enhance the automation of claims processing. Key Features Offers scalable and accessible datamanagement from any location, enhancing the flexibility of claims operations. It reduc es the time spent switching between different systems and databases.
While all data transformation solutions can generate flat files in CSV or similar formats, the most efficient data prep implementations will also easily integrate with your other productivity business intelligence (BI) tools. Manual export and import steps in a system can add complexity to your data pipeline.
Datamanagement can be a daunting task, requiring significant time and resources to collect, process, and analyze large volumes of information. For instance, Coca-Cola uses AI-powered ETL tools to automate data integration tasks across its global supply chain to optimize procurement and sourcing processes.
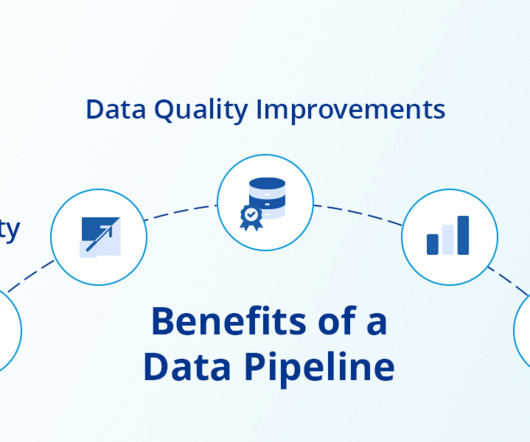
Importance of Data Pipelines Data pipelines are essential for the smooth, automated, and reliable management of data throughout its lifecycle. They enable organizations to derive maximum value from their data assets. The data consumption layer needs to be designed to easy access to the data.
Data analysis tools are software solutions, applications, and platforms that simplify and accelerate the process of analyzing large amounts of data. They enable business intelligence (BI), analytics, datavisualization , and reporting for businesses so they can make important decisions timely.
DataVisualization Once the analysis is complete, the results are interpreted to generate findings relevant to the business. Datavisualization presents these findings in a clear and understandable format: Creating Visuals : Representing analysis results with charts, graphs, and dashboards.
4) Big Data: Principles and Best Practices Of Scalable Real-TimeData Systems by Nathan Marz and James Warren. Best for: For readers that want to learn the theory of big data systems, how to implement them in practice, and how to deploy and operate them once they’re built. Croll and B.
When your customers deliver analytics and reporting, the datavisualization experience should be a memorable one. Your customers and their users need real-timedata to tell an engaging, flexible, and accurate story to drive impactful business results. Where do you go to get the latest on a breaking media story?
Streaming data pipelines enable organizations to gain immediate insights from real-timedata and respond quickly to changes in their environment. They are commonly used in scenarios such as fraud detection, predictive maintenance, real-time analytics, and personalized recommendations.
By integrating Vizlib, businesses can truly maximize their Qlik investment, improving decision-making efficiency and gaining deeper insights from their data. The Growing Importance of DataVisualization In the era of big data, the ability to visualize information has become a cornerstone of effective business analytics.
How Embedded Dashboards Work Embedded Dashboards work by embedding datavisualizations and analytics tools into existing applications or systems. They’re usually powered by an underlying analytics platform and connected through APIs, allowing the dashboard to pull real-timedata directly from various data sources.
It allows organizations to integrate business-level AI, interactive datavisualizations, dashboards, and reports, thereby enriching the value and engagement of every application. Data utilization is bolstered by Logi Composer’s Python data connector , enabling real-timedata access and visualization from APIs.
This empowered Brivo’s customers to transform raw data into valuable security intelligence, ultimately strengthening their physical security measures. Logi Symphony’s out-of-the-box features like data joining and multi-platform support further enhanced the solution.
Logi Symphony and ChatGPT Will Change the Way you Interact with Data The integration of ChatGPT into Logi Symphony opens a world of possibilities for data-driven decision-making and analysis. By leveraging the power of AI and data integration, you can gain deeper insights into your data and make more informed decisions.
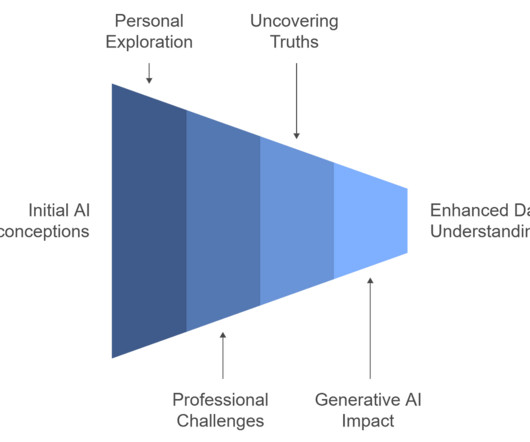
Every action you take online — whether it’s a click or a purchase — generates valuable data. Organizations realized that instead of letting this data sit unused, they could harness it for strategic advantage. With the rise of datavisualization tools, insights that were once hidden have come to light.
AI agents take this a step further by operating independently and making real-time decisions. AI agents are intelligent software programs that perform tasks independently and make decisions according to predefined goals and real-timedata. But what exactly are they?
Advanced reporting and business intelligence platforms offer features like real-timedatavisualization, predictive analytics, and seamless collaborationcapabilities that are hard to achieve with aging systems.
We organize all of the trending information in your field so you don't have to. Join 57,000+ users and stay up to date on the latest articles your peers are reading.
You know about us, now we want to get to know you!
Let's personalize your content
Let's get even more personalized
We recognize your account from another site in our network, please click 'Send Email' below to continue with verifying your account and setting a password.


Let's personalize your content