This site uses cookies to improve your experience. To help us insure we adhere to various privacy regulations, please select your country/region of residence. If you do not select a country, we will assume you are from the United States. Select your Cookie Settings or view our Privacy Policy and Terms of Use.
Cookie Settings
Cookies and similar technologies are used on this website for proper function of the website, for tracking performance analytics and for marketing purposes. We and some of our third-party providers may use cookie data for various purposes. Please review the cookie settings below and choose your preference.
Used for the proper function of the website
Used for monitoring website traffic and interactions
Cookie Settings
Cookies and similar technologies are used on this website for proper function of the website, for tracking performance analytics and for marketing purposes. We and some of our third-party providers may use cookie data for various purposes. Please review the cookie settings below and choose your preference.
Strictly Necessary: Used for the proper function of the website
Performance/Analytics: Used for monitoring website traffic and interactions
Smart DataVisualization Guides Users to Clear Data in the Right View! Features like smart datavisualization make it easy to see what is happening, where the source of a problem lies and what market opportunities may be ripe for the taking.
Smart DataVisualization Guides Users to Clear Data in the Right View! Features like smart datavisualization make it easy to see what is happening, where the source of a problem lies and what market opportunities may be ripe for the taking.
Smart DataVisualization Guides Users to Clear Data in the Right View! Features like smart datavisualization make it easy to see what is happening, where the source of a problem lies and what market opportunities may be ripe for the taking.
Smart DataVisualization Makes Your Users Smarter! What on earth is smart datavisualization? Is it a computer that actually ‘sees’ data for you and does the analysis? Get Smart DataVisualization! It is not magic!
Smart DataVisualization Makes Your Users Smarter! What on earth is smart datavisualization? Is it a computer that actually ‘sees’ data for you and does the analysis? Get Smart DataVisualization! It is not magic!
Smart DataVisualization Makes Your Users Smarter! What on earth is smart datavisualization? Is it a computer that actually ‘sees’ data for you and does the analysis? If smart datavisualization sounds like something you could use, you can explore the benefits here: Smart DataVisualization.
Smart DataVisualization Takes the Guesswork Out of Analytics! Smart datavisualization tools should include augmented datadiscovery with features that guide and show business users how to get the most out of data and how to display that data in a way that will make decision-making and analysis as easy as drag and drop.
Smart DataVisualization Takes the Guesswork Out of Analytics! Smart datavisualization tools should include augmented datadiscovery with features that guide and show business users how to get the most out of data and how to display that data in a way that will make decision-making and analysis as easy as drag and drop.
Smart DataVisualization Takes the Guesswork Out of Analytics! Smart datavisualization tools should include augmented datadiscovery with features that guide and show business users how to get the most out of data and how to display that data in a way that will make decision-making and analysis as easy as drag and drop.
Can Smart DataVisualization Make My Business Smarter? All the data in the world can’t help you improve your business results unless you can sift through it and see it in a way that tells a story – a story that leads you to a conclusion, helps you solve a problem or allows you to see how your business can grow, change and succeed.
Can Smart DataVisualization Make My Business Smarter? All the data in the world can’t help you improve your business results unless you can sift through it and see it in a way that tells a story – a story that leads you to a conclusion, helps you solve a problem or allows you to see how your business can grow, change and succeed.
If you are considering a Business Intelligence solution, you ought to give some consideration to the concept of Smart DataVisualization and review your prospective solution to determine its capabilities in that regard. How do users perceive and use data? How does a user identify a pattern or trend?
If you are considering a Business Intelligence solution, you ought to give some consideration to the concept of Smart DataVisualization and review your prospective solution to determine its capabilities in that regard. How do users perceive and use data? How does a user identify a pattern or trend?
If you are considering a Business Intelligence solution, you ought to give some consideration to the concept of Smart DataVisualization and review your prospective solution to determine its capabilities in that regard. How do users perceive and use data? How does a user identify a pattern or trend?
Why Should I Care About Smart Visualization and Advanced DataDiscovery? Are you up on the latest analytics lingo or do you still think smart visualization is some kind of artificial eyeball? The Smarten approach to data analytics will get you there.
Why Should I Care About Smart Visualization and Advanced DataDiscovery? Are you up on the latest analytics lingo or do you still think smart visualization is some kind of artificial eyeball? The Smarten approach to data analytics will get you there.
Why Should I Care About Smart Visualization and Advanced DataDiscovery? Are you up on the latest analytics lingo or do you still think smart visualization is some kind of artificial eyeball? The Smarten approach to data analytics will get you there.
DataVisualization Tools Provide Crucial Decision Support! If they are to help your users achieve their goals and understand what is happening within your organization, datavisualization tools must be easy to use, with sophisticated functionality and an intuitive user interface.
DataVisualization Tools Provide Crucial Decision Support! If they are to help your users achieve their goals and understand what is happening within your organization, datavisualization tools must be easy to use, with sophisticated functionality and an intuitive user interface.
DataVisualization Tools Provide Crucial Decision Support! If they are to help your users achieve their goals and understand what is happening within your organization, datavisualization tools must be easy to use, with sophisticated functionality and an intuitive user interface.
From a single solution, organizations can embed cost-effective AI, interactive datavisualizations, dashboards, and reports, enhancing the value and engagement of any application RALEIGH, N.C. The process is complex, requiring a high degree of customization and extensive experience preparing and accessing data for analysis.
The new task of designers will be facilitating an ambient userexperience that smoothly flows across and exploits different devices. Today, with solutions like datapine’s, you can take your data everywhere you go and work with it flawlessly. With the Internet of Things, the physical world will become one big information system.
With these new features analysts now have the industry’s first end-to-end platform for data connection, preparation, discovery, visualization, collaboration and optimization. This addition bolsters Domo’s unmatched free solution for end-to-end data integration, datadiscovery and sharing in the cloud.
Kuber Sharma Director, Product Marketing, Tableau Kristin Adderson August 22, 2023 - 12:11am August 22, 2023 Whether you're a novice data analyst exploring the possibilities of Tableau or a leader with years of experience using VizQL to gain advanced insights—this is your list of key Tableau features you should know, from A to Z.
The real beauty of Smart DataVisualization is that it is built within an Augmented Analytics environment that is designed for the average business user without advanced technical skills.’ What is Smart DataVisualization? How Does Smart DataVisualization Work?
The real beauty of Smart DataVisualization is that it is built within an Augmented Analytics environment that is designed for the average business user without advanced technical skills.’ What is Smart DataVisualization? How Does Smart DataVisualization Work?
The real beauty of Smart DataVisualization is that it is built within an Augmented Analytics environment that is designed for the average business user without advanced technical skills.’. What is Smart DataVisualization? How Does Smart DataVisualization Work?
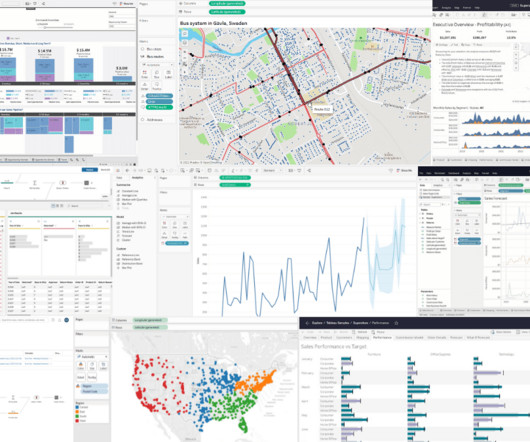
Business intelligence solutions have come a long way in the past five years with continued innovation and transformation from traditional BI to datavisualization and datadiscovery. Vendors like Tableau have excellent datadiscovery tools and Qlikview is catching up by launching Qlik Sense.
Business intelligence solutions have come a long way in the past five years with continued innovation and transformation from traditional BI to datavisualization and datadiscovery. Vendors like Tableau have excellent datadiscovery tools and Qlikview is catching up by launching Qlik Sense.
Business intelligence solutions have come a long way in the past five years with continued innovation and transformation from traditional BI to datavisualization and datadiscovery. Vendors like Tableau have excellent datadiscovery tools and Qlikview is catching up by launching Qlik Sense.
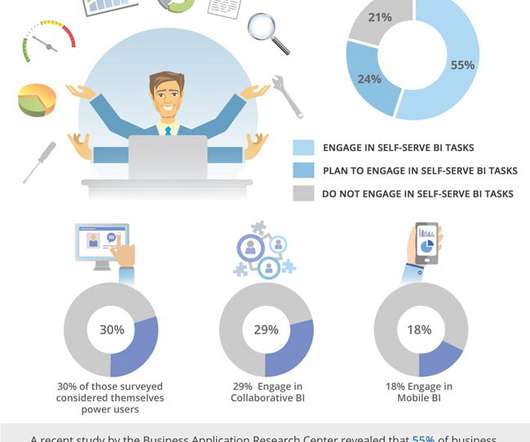
So, why is everyone so excited about the concept of Citizen Data Scientists? The simple truth is that when business users become Citizen Data Scientists, each of them can add more value and benefit to the organization. It’s simple!
So, why is everyone so excited about the concept of Citizen Data Scientists? The simple truth is that when business users become Citizen Data Scientists, each of them can add more value and benefit to the organization. It’s simple!
So, why is everyone so excited about the concept of Citizen Data Scientists? The simple truth is that when business users become Citizen Data Scientists, each of them can add more value and benefit to the organization. It’s simple!
This native app has a seamless user interface for a great userexperience (UX). Smarten CEO, Kartik Patel says, “The availability of Smarten augmented analytics on a mobile device encourages user adoption and provides support for business intelligence investments and data democratization.” Installation is easy.
This native app has a seamless user interface for a great userexperience (UX). Smarten CEO, Kartik Patel says, “The availability of Smarten augmented analytics on a mobile device encourages user adoption and provides support for business intelligence investments and data democratization.” Installation is easy.
This native app has a seamless user interface for a great userexperience (UX). Smarten CEO, Kartik Patel says, “The availability of Smarten augmented analytics on a mobile device encourages user adoption and provides support for business intelligence investments and data democratization.”. Installation is easy.
This is in contrast to traditional BI, which extracts insight from data outside of the app. According to the 2021 State of Analytics: Why Users Demand Better report by Hanover Research, 77 percent of organizations consider end-userdata literacy “very” or “extremely important” in making fast and accurate decisions.
With enhanced security, customization, scalability, and user empowerment, embedded analytics is a true path forward for analytics teams seeking to thrive in today’s data-driven business landscape. Striking the right balance between functionality and a streamlined user interface within the host application is a delicate art.
It allows organizations to integrate business-level AI, interactive datavisualizations, dashboards, and reports, thereby enriching the value and engagement of every application. We enhanced the software with accessibility features and third-party tools for a better userexperience.
Analytics and datavisualizations have the power to elevate a software product, making it a powerful tool that helps each user fulfill their mission more effectively. Although datadiscovery applications have their place, they’re not designed to seamlessly integrate with an existing application’s workflows.
This empowered Brivo’s customers to transform raw data into valuable security intelligence, ultimately strengthening their physical security measures. Logi Symphony’s out-of-the-box features like data joining and multi-platform support further enhanced the solution.
Logi Symphony is a powerful embedded business intelligence and analytics software suite that empowers independent software vendors and application teams to embed analytical capabilities and datavisualizations into your SaaS applications. Extend AI’s reach with seamless embedding.
We organize all of the trending information in your field so you don't have to. Join 57,000+ users and stay up to date on the latest articles your peers are reading.
You know about us, now we want to get to know you!
Let's personalize your content
Let's get even more personalized
We recognize your account from another site in our network, please click 'Send Email' below to continue with verifying your account and setting a password.


Let's personalize your content