This site uses cookies to improve your experience. To help us insure we adhere to various privacy regulations, please select your country/region of residence. If you do not select a country, we will assume you are from the United States. Select your Cookie Settings or view our Privacy Policy and Terms of Use.
Cookie Settings
Cookies and similar technologies are used on this website for proper function of the website, for tracking performance analytics and for marketing purposes. We and some of our third-party providers may use cookie data for various purposes. Please review the cookie settings below and choose your preference.
Used for the proper function of the website
Used for monitoring website traffic and interactions
Cookie Settings
Cookies and similar technologies are used on this website for proper function of the website, for tracking performance analytics and for marketing purposes. We and some of our third-party providers may use cookie data for various purposes. Please review the cookie settings below and choose your preference.
Strictly Necessary: Used for the proper function of the website
Performance/Analytics: Used for monitoring website traffic and interactions
Advanced Analytics Software and Smart Visualization Empowers Business Users. Advanced Analytics Software, DataDiscovery Tools and Smart Visualization can improve your planning and forecasting process, and empower your organization. Datavisualization transforms business users into Citizen Data Scientists.
Advanced Analytics Software and Smart Visualization Empowers Business Users. Advanced Analytics Software, DataDiscovery Tools and Smart Visualization can improve your planning and forecasting process, and empower your organization. Datavisualization transforms business users into Citizen Data Scientists.
Advanced Analytics Software and Smart Visualization Empowers Business Users. Advanced Analytics Software, DataDiscovery Tools and Smart Visualization can improve your planning and forecasting process, and empower your organization. Datavisualization transforms business users into Citizen Data Scientists.
Smart DataVisualization can radically improve your business intelligence, datadiscovery and analytics. It can streamline the work process of business users, improve the accuracy of planning and forecasting and ensure better, more timely, more accurate business decisions. What is Smart DataVisualization?
Smart DataVisualization can radically improve your business intelligence, datadiscovery and analytics. It can streamline the work process of business users, improve the accuracy of planning and forecasting and ensure better, more timely, more accurate business decisions. What is Smart DataVisualization?
Smart DataVisualization can radically improve your business intelligence, datadiscovery and analytics. It can streamline the work process of business users, improve the accuracy of planning and forecasting and ensure better, more timely, more accurate business decisions. What is Smart DataVisualization?
If you are considering a Business Intelligence solution, you ought to give some consideration to the concept of Smart DataVisualization and review your prospective solution to determine its capabilities in that regard. How do users perceive and use data? How do formats and reporting affect a user’s understanding of data?
If you are considering a Business Intelligence solution, you ought to give some consideration to the concept of Smart DataVisualization and review your prospective solution to determine its capabilities in that regard. How do users perceive and use data? How do formats and reporting affect a user’s understanding of data?
If you are considering a Business Intelligence solution, you ought to give some consideration to the concept of Smart DataVisualization and review your prospective solution to determine its capabilities in that regard. How do users perceive and use data? How do formats and reporting affect a user’s understanding of data?
There is no doubt that the Business Intelligence market has moved toward Advanced DataDiscovery tools and self-serve tools like Self-Serve Data Preparation, and Plug n’ Play Predictive Analysis. Contact Us and find out more about the ever-expanding world of self-serve analytics.
There is no doubt that the Business Intelligence market has moved toward Advanced DataDiscovery tools and self-serve tools like Self-Serve Data Preparation, and Plug n’ Play Predictive Analysis. Contact Us and find out more about the ever-expanding world of self-serve analytics.
There is no doubt that the Business Intelligence market has moved toward Advanced DataDiscovery tools and self-serve tools like Self-Serve Data Preparation, and Plug n’ Play Predictive Analysis. Contact Us and find out more about the ever-expanding world of self-serve analytics.
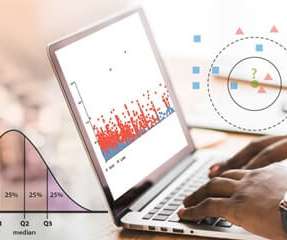
Smart DataVisualization Helps Your Users to Gain Insight! Included in this solution is Smart DataVisualization. This feature suggests the best options for visualizing and plotting for a particular set or type of data, based on the nature, dimensions and trend of data.
Smart DataVisualization Helps Your Users to Gain Insight! Included in this solution is Smart DataVisualization. This feature suggests the best options for visualizing and plotting for a particular set or type of data, based on the nature, dimensions and trend of data.
Smart DataVisualization Helps Your Users to Gain Insight! Included in this solution is Smart DataVisualization. This feature suggests the best options for visualizing and plotting for a particular set or type of data, based on the nature, dimensions and trend of data.
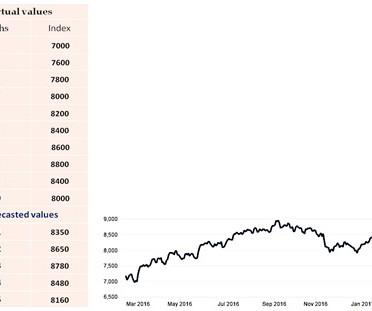
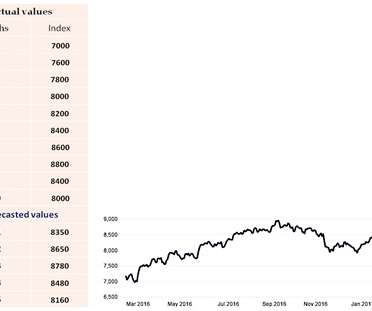
Business Benefit: The business can make use of these forecasts for better planning of drug production and accuracy of sales targets. The ARIMA forecasting method is suitable for forecasting when data is stationary or non-stationary and is univariate with any type of data pattern.
Business Benefit: The business can make use of these forecasts for better planning of drug production and accuracy of sales targets. The ARIMA forecasting method is suitable for forecasting when data is stationary or non-stationary and is univariate with any type of data pattern.
Business Benefit: The business can make use of these forecasts for better planning of drug production and accuracy of sales targets. The ARIMA forecasting method is suitable for forecasting when data is stationary or non-stationary and is univariate with any type of data pattern. About Smarten.
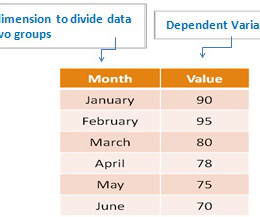
The dependent variable is crop production data during the monsoon months of the last year. The Smarten approach to datadiscovery is designed as an augmented analytics solution to serve business users.
The dependent variable is crop production data during the monsoon months of the last year. The Smarten approach to datadiscovery is designed as an augmented analytics solution to serve business users.
The dependent variable is crop production data during the monsoon months of the last year. The Smarten approach to business intelligence and business analytics focuses on the business user and provides Advanced DataDiscovery so users can perform early prototyping and test hypotheses without the skills of a data scientist.
To accurately predict and plan, every enterprise must select a business intelligence solution that will support their efforts and provide business users with a rich set of features and tools. One of the most important elements of advanced datadiscovery and advanced analytics tools is plug n’ play predictive analysis and forecasting tools.
To accurately predict and plan, every enterprise must select a business intelligence solution that will support their efforts and provide business users with a rich set of features and tools. One of the most important elements of advanced datadiscovery and advanced analytics tools is plug n’ play predictive analysis and forecasting tools.
To accurately predict and plan, every enterprise must select a business intelligence solution that will support their efforts and provide business users with a rich set of features and tools. One of the most important elements of advanced datadiscovery and advanced analytics tools is plug n’ play predictive analysis and forecasting tools.
Today’s Advanced Analytics Tools allow business users to leverage features like self-serve data preparation, smart datavisualization and assisted predictive modeling. Business markets and competition are moving much more quickly these days and predicting, planning and forecasting is more important than ever.
Today’s Advanced Analytics Tools allow business users to leverage features like self-serve data preparation, smart datavisualization and assisted predictive modeling. Business markets and competition are moving much more quickly these days and predicting, planning and forecasting is more important than ever.
Today’s Advanced Analytics Tools allow business users to leverage features like self-serve data preparation, smart datavisualization and assisted predictive modeling. Business markets and competition are moving much more quickly these days and predicting, planning and forecasting is more important than ever.
Editors note: This blog was originally published in October 2013, and has been completely revamped and updated for accuracy, relevancy, and comprehensiveness in September 2019 Prior to the 17th century, datavisualization existed mainly in the realm of maps, displaying land markers, cities, roads, and resources.
ARIMAX provides forecasted values of the target variables for user-specified time periods to clearly illustrate results for planning, production, sales and other factors. These tools are designed for business users with average skills and require no specialized knowledge of statistical analysis or support from IT or data scientists.
ARIMAX provides forecasted values of the target variables for user-specified time periods to clearly illustrate results for planning, production, sales and other factors. These tools are designed for business users with average skills and require no specialized knowledge of statistical analysis or support from IT or data scientists.
ARIMAX provides forecasted values of the target variables for user-specified time periods to clearly illustrate results for planning, production, sales and other factors. About Smarten.
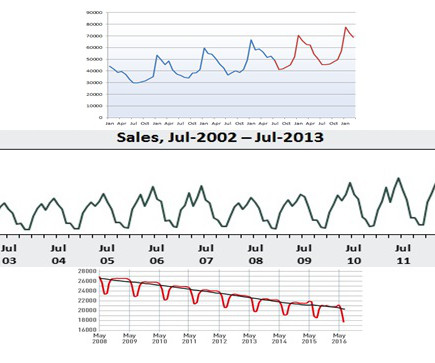
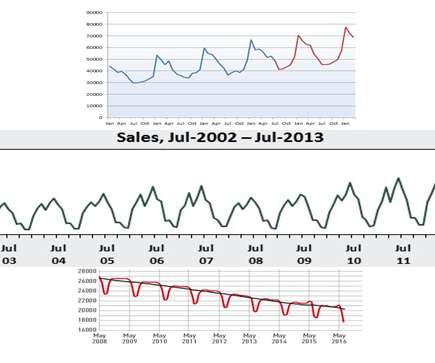
In this article, we will focus on the identification and exploration of data patterns and the trends that data reveals. The business can use this information for forecasting and planning, and to test theories and strategies.
In this article, we will focus on the identification and exploration of data patterns and the trends that data reveals. The business can use this information for forecasting and planning, and to test theories and strategies.
In this article, we will focus on the identification and exploration of data patterns and the trends that data reveals. The business can use this information for forecasting and planning, and to test theories and strategies.
A BI dashboard — or business intelligence dashboard — is an information management tool that uses datavisualization to display KPIs (key performance indicators) tracked by a business to assess various aspects of performance. They aim at simplifying huge amounts of data, into simpler insights that can been easily understood and used.
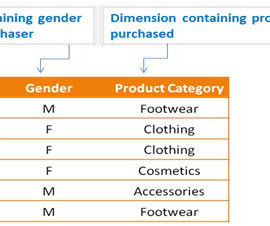
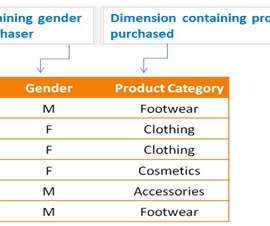
Finance – An organization might use this technique to Identify if demographic factors influence banking channel/product/service preference or selection of a type of term plan of an insurance etc. The Smarten approach to datadiscovery is designed as an augmented analytics solution to serve business users.
Finance – An organization might use this technique to Identify if demographic factors influence banking channel/product/service preference or selection of a type of term plan of an insurance etc. The Smarten approach to datadiscovery is designed as an augmented analytics solution to serve business users.
Finance – An organization might use this technique to Identify if demographic factors influence banking channel/product/service preference or selection of a type of term plan of an insurance etc. How Can the Chi Square Test of Association Be Used for Business Analysis?
This article summarizes our recent article series on the definition, meaning and use of the various algorithms and analytical methods and techniques used in predictive analytics for business users, and in augmented data preparation and augmented datadiscovery tools.
Let’s say that a medical organization wishes to measure the blood pressure of patient A, and then recommend a treatment plan like medication, diet or exercise to reduce his blood pressure, after which the organization would measure the blood pressure of patient A again. Here is another example.
Let’s say that a medical organization wishes to measure the blood pressure of patient A, and then recommend a treatment plan like medication, diet or exercise to reduce his blood pressure, after which the organization would measure the blood pressure of patient A again. Here is another example.
We organize all of the trending information in your field so you don't have to. Join 57,000+ users and stay up to date on the latest articles your peers are reading.
You know about us, now we want to get to know you!
Let's personalize your content
Let's get even more personalized
We recognize your account from another site in our network, please click 'Send Email' below to continue with verifying your account and setting a password.


Let's personalize your content