This site uses cookies to improve your experience. To help us insure we adhere to various privacy regulations, please select your country/region of residence. If you do not select a country, we will assume you are from the United States. Select your Cookie Settings or view our Privacy Policy and Terms of Use.
Cookie Settings
Cookies and similar technologies are used on this website for proper function of the website, for tracking performance analytics and for marketing purposes. We and some of our third-party providers may use cookie data for various purposes. Please review the cookie settings below and choose your preference.
Used for the proper function of the website
Used for monitoring website traffic and interactions
Cookie Settings
Cookies and similar technologies are used on this website for proper function of the website, for tracking performance analytics and for marketing purposes. We and some of our third-party providers may use cookie data for various purposes. Please review the cookie settings below and choose your preference.
Strictly Necessary: Used for the proper function of the website
Performance/Analytics: Used for monitoring website traffic and interactions
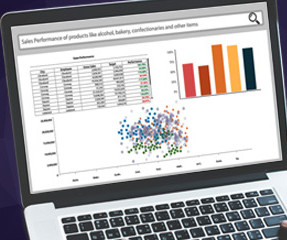
Advanced Analytics Software and Smart Visualization Empowers Business Users. Advanced Analytics Software, DataDiscovery Tools and Smart Visualization can improve your planning and forecasting process, and empower your organization. Datavisualization transforms business users into Citizen Data Scientists.
Advanced Analytics Software and Smart Visualization Empowers Business Users. Advanced Analytics Software, DataDiscovery Tools and Smart Visualization can improve your planning and forecasting process, and empower your organization. Datavisualization transforms business users into Citizen Data Scientists.
Advanced Analytics Software and Smart Visualization Empowers Business Users. Advanced Analytics Software, DataDiscovery Tools and Smart Visualization can improve your planning and forecasting process, and empower your organization. Datavisualization transforms business users into Citizen Data Scientists.
If you are considering a Business Intelligence solution, you ought to give some consideration to the concept of Smart DataVisualization and review your prospective solution to determine its capabilities in that regard. How do users perceive and use data? How do formats and reporting affect a user’s understanding of data?
If you are considering a Business Intelligence solution, you ought to give some consideration to the concept of Smart DataVisualization and review your prospective solution to determine its capabilities in that regard. How do users perceive and use data? How do formats and reporting affect a user’s understanding of data?
If you are considering a Business Intelligence solution, you ought to give some consideration to the concept of Smart DataVisualization and review your prospective solution to determine its capabilities in that regard. How do users perceive and use data? How do formats and reporting affect a user’s understanding of data?
There is no doubt that the Business Intelligence market has moved toward Advanced DataDiscovery tools and self-serve tools like Self-Serve Data Preparation, and Plug n’ Play Predictive Analysis. Contact Us and find out more about the ever-expanding world of self-serve analytics.
There is no doubt that the Business Intelligence market has moved toward Advanced DataDiscovery tools and self-serve tools like Self-Serve Data Preparation, and Plug n’ Play Predictive Analysis. Contact Us and find out more about the ever-expanding world of self-serve analytics.
There is no doubt that the Business Intelligence market has moved toward Advanced DataDiscovery tools and self-serve tools like Self-Serve Data Preparation, and Plug n’ Play Predictive Analysis. Contact Us and find out more about the ever-expanding world of self-serve analytics.
They can use the data resulting from this analysis to make decisions and move the organisation forward without the cost, time and resources required in the old data analysis environment. Imagine how much more productive they can be by simply letting these innovative BI tools do the legwork.
Table of Contents 1) The Benefits Of DataVisualization 2) Our Top 27 Best DataVisualizations 3) Interactive DataVisualization: What’s In It For Me? 4) Static vs. Animated DataVisualizationData is the new oil? No, data is the new soil.”
Clients, partners and technology innovators are invited to visit Stall No 36, in Hall #1 to experience the Smarten approach to advanced analytics. ElegantJ BI announces its participation in The Vibrant Gujarat StartUp & Technology Summit 2018, October 11 through October 13 at the Helipad Exhibition Centre in Gandhinagar, Gujarat, India.
Clients, partners and technology innovators are invited to visit Stall No 36, in Hall #1 to experience the Smarten approach to advanced analytics. ElegantJ BI announces its participation in The Vibrant Gujarat StartUp & Technology Summit 2018, October 11 through October 13 at the Helipad Exhibition Centre in Gandhinagar, Gujarat, India.
Clients, partners and technology innovators are invited to visit Stall No 36, in Hall #1 to experience the Smarten approach to advanced analytics. ElegantJ BI announces its participation in The Vibrant Gujarat StartUp & Technology Summit 2018, October 11 through October 13 at the Helipad Exhibition Centre in Gandhinagar, Gujarat, India.
They can use the data resulting from this analysis to make decisions and move the organisation forward without the cost, time and resources required in the old data analysis environment. Imagine how much more productive they can be by simply letting these innovative BI tools do the legwork.
They can use the data resulting from this analysis to make decisions and move the organisation forward without the cost, time and resources required in the old data analysis environment. Imagine how much more productive they can be by simply letting these innovative BI tools do the legwork.
Editors note: This blog was originally published in October 2013, and has been completely revamped and updated for accuracy, relevancy, and comprehensiveness in September 2019 Prior to the 17th century, datavisualization existed mainly in the realm of maps, displaying land markers, cities, roads, and resources.
One of the most important elements of advanced datadiscovery and advanced analytics tools is plug n’ play predictive analysis and forecasting tools. These tools can support the enterprise initiative to implement self-serve advanced analytics and transform business users into Citizen Data Scientists.
One of the most important elements of advanced datadiscovery and advanced analytics tools is plug n’ play predictive analysis and forecasting tools. These tools can support the enterprise initiative to implement self-serve advanced analytics and transform business users into Citizen Data Scientists.
One of the most important elements of advanced datadiscovery and advanced analytics tools is plug n’ play predictive analysis and forecasting tools. These tools can support the enterprise initiative to implement self-serve advanced analytics and transform business users into Citizen Data Scientists. About Kartik Patel.
We had a great response, especially with our Smarten Advanced DataDiscovery with self serve data prep, smart visualization and plug n’ play predictive analytics. Our team offered demonstrations of the ElegantJ BI solution at the booth and I am happy to say that our demos were very well received.
We had a great response, especially with our Smarten Advanced DataDiscovery with self serve data prep, smart visualization and plug n’ play predictive analytics. Our team offered demonstrations of the ElegantJ BI solution at the booth and I am happy to say that our demos were very well received.
We had a great response, especially with our Smarten Advanced DataDiscovery with self serve data prep, smart visualization and plug n’ play predictive analytics. Our team offered demonstrations of the ElegantJ BI solution at the booth and I am happy to say that our demos were very well received.
In the current wave of data, to stay ahead in the curve, a business needs to master those tools that businesses use to make smart decisions. Enter Power BI-a powerful, dynamic tool dramatically changing the way companies analyze and see their data. It features rich visualizations with highly interactive dashboards.
2022 Technology Innovation Awards recognize insightsoftware, based on end user feedback and real-world perspectives RALEIGH, N.C. Logi Embedded Analytics and Business Intelligence from insightsoftware enable software teams to rapidly design, build, and embed interactive dashboards and datavisualizations.
No more gut feelings or crossed fingers, AI helps you make faster, more accurate, and innovative decisions. Explore AI in data analysis with our AI Certification for Data Analysts and get Power BI training at our Power BI course page. demand spikes) using historical data. Customers aged 2534 prefer mobile app purchases).
” As a professional in the Industry for long, I have seen this word being used innovatively to describe Cognos, Business Objects, QlikView and Power BI. From reporting to visualised dashboard to predictive analytics. So let us look at what entails BI now and what it will include in future.
This means that your business’s data is available and secure regardless of a data breach or system failure. Now that we’ve explored the key characteristics of software as a service innovations, it’s time to delve into the top SaaS trends in 2020. Learn what will enhance the SaaS infrastructure in our free cheat sheet!
You can view business intelligence as an extremely powerful datadiscovery tool that is an extension of your fast thinking mind. They enable powerful datavisualization. To make the most out of it, there is an important dimension to disclose: datavisualization. Control your entire procurement operation.
To explain this most essential of 2020 buzzwords: connected retail is the seamless bridge between physical and digital retail, creating a connected, cloud-based ecosystem for enhanced consumer experience and advanced data collection. But hyperautomation is an innovation in its infancy, and it’s expected to explode in 2020.
Many of you must have an idea about Tableau being used for datavisualization and to infer insights. TABLEAU revolutionized Business Intelligence and paved the way for intuitive VisualData Analytics for everyone, regardless of their technical knowledge. Visual analytics combines data analytics and datavisualization.
Here’s what’s new: Analyzer – A brand new set of datadiscovery tools that will be incorporated into the Domo platform and included in Domo’s free offering. With Analyzer, analysts will have one workspace from which they can choose and explore all data sets and simultaneously display data tables alongside visualizations.
” As a professional in the Industry for long, I have seen this word being used innovatively to describe Cognos, Business Objects, QlikView and Power BI. From reporting to visualised dashboard to predictive analytics. So let us look at what entails BI now and what it will include in future.
” As a professional in the Industry for long, I have seen this word being used innovatively to describe Cognos, Business Objects, QlikView and Power BI. From reporting to visualised dashboard to predictive analytics. So let us look at what entails BI now and what it will include in future.
Since we live in a digital age, where datadiscovery and big data simply surpass the traditional storage and manual implementation and manipulation of business information, companies are searching for the best possible solution for handling data. It is evident that the cloud is expanding. The Future Of Cloud Computing.
Business leaders, developers, data heads, and tech enthusiasts – it’s time to make some room on your business intelligence bookshelf because once again, datapine has new books for you to add. We have already given you our top datavisualization books , top business intelligence books , and best data analytics books.
Statistical Analysis : Using statistics to interpret data and identify trends. Predictive Analytics : Employing models to forecast future trends based on historical data. DataVisualization : Presenting datavisually to make the analysis understandable to stakeholders.
AI-powered ETL tools can automate repetitive tasks, optimize performance, and reduce the potential for human error. By AI taking care of low-level tasks, data engineers can focus on higher-level tasks such as designing data models and creating datavisualizations.
These are some quick answers to some common questions I get about Business Intelligence, Big Data, and Analytics: Big Data. Why is it still important for innovative businesses? It’s clear that data is one of the most important assets of the future. Good datavisualization is vital.
1) What Is DataDiscovery? 2) Why is DataDiscovery So Popular? 3) DataDiscovery Tools Attributes. 5) How To Perform Smart DataDiscovery. 6) DataDiscovery For The Modern Age. We live in a time where data is all around us. So, what is datadiscovery?
ElegantJ BI , an innovative vendor in Business Intelligence and Augmented Analytics, is pleased to announce that ElegantJ BI is named as Representative Vendors in the Gartner ‘ Market Guide for Traditional Enterprise Reporting Platforms ‘ report published September 28, 2017.
We organize all of the trending information in your field so you don't have to. Join 57,000+ users and stay up to date on the latest articles your peers are reading.
You know about us, now we want to get to know you!
Let's personalize your content
Let's get even more personalized
We recognize your account from another site in our network, please click 'Send Email' below to continue with verifying your account and setting a password.


Let's personalize your content