This site uses cookies to improve your experience. To help us insure we adhere to various privacy regulations, please select your country/region of residence. If you do not select a country, we will assume you are from the United States. Select your Cookie Settings or view our Privacy Policy and Terms of Use.
Cookie Settings
Cookies and similar technologies are used on this website for proper function of the website, for tracking performance analytics and for marketing purposes. We and some of our third-party providers may use cookie data for various purposes. Please review the cookie settings below and choose your preference.
Used for the proper function of the website
Used for monitoring website traffic and interactions
Cookie Settings
Cookies and similar technologies are used on this website for proper function of the website, for tracking performance analytics and for marketing purposes. We and some of our third-party providers may use cookie data for various purposes. Please review the cookie settings below and choose your preference.
Strictly Necessary: Used for the proper function of the website
Performance/Analytics: Used for monitoring website traffic and interactions
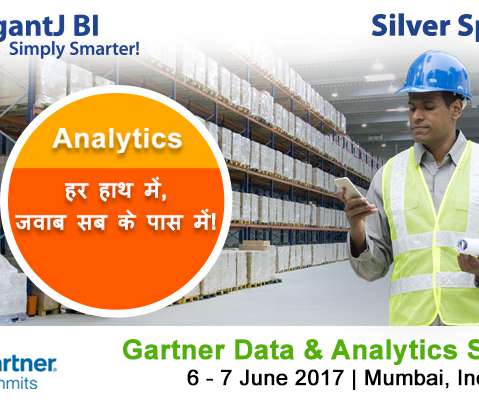
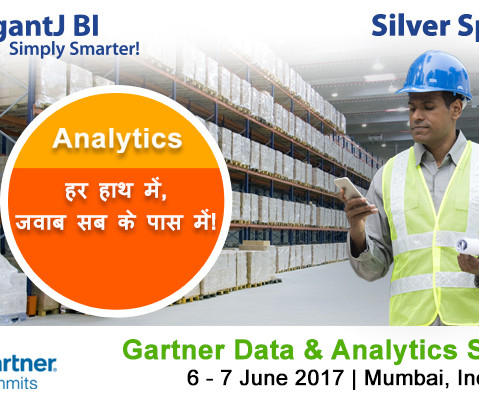
ElegantJ BI is pleased to be a Silver Sponsor at the Gartner Data & Analytics Summit, which will be held on June 6 and 7, 2017 in Mumbai, India. The ElegantJ BI team is pleased to participate as a Silver Sponsor in this event. ” About ElegantJ BI.
ElegantJ BI is pleased to be a Silver Sponsor at the Gartner Data & Analytics Summit, which will be held on June 6 and 7, 2017 in Mumbai, India. The ElegantJ BI team is pleased to participate as a Silver Sponsor in this event.
ElegantJ BI is pleased to be a Silver Sponsor at the Gartner Data & Analytics Summit, which will be held on June 6 and 7, 2017 in Mumbai, India. The ElegantJ BI team is pleased to participate as a Silver Sponsor in this event.
The theme of the Summit was Information & Analytics Leadership: Empowering People with Trusted Data, and the Summit did not disappoint, and it was a really vibrant, exciting experience! This year, the event was bigger and better than ever, with more than 600 people in attendance. The food and hospitality were great.
The theme of the Summit was Information & Analytics Leadership: Empowering People with Trusted Data, and the Summit did not disappoint, and it was a really vibrant, exciting experience! This year, the event was bigger and better than ever, with more than 600 people in attendance. The food and hospitality were great.
The theme of the Summit was Information & Analytics Leadership: Empowering People with Trusted Data, and the Summit did not disappoint, and it was a really vibrant, exciting experience! This year, the event was bigger and better than ever, with more than 600 people in attendance. The food and hospitality were great.
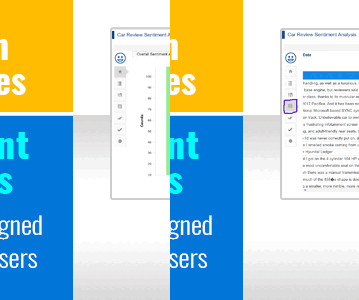
Smarten Sentiment Analysis provides a powerful Artificial Intelligence (AI) technique to analyze customer feedback, and understand attitudes about products, events, trends, etc. “Sentiment Analysis can help you solve problems,” says Patel, ‘And it can identify opportunities and improve your brand image and competitive stance in the market.’
Smarten Sentiment Analysis provides a powerful Artificial Intelligence (AI) technique to analyze customer feedback, and understand attitudes about products, events, trends, etc. “Sentiment Analysis can help you solve problems,” says Patel, ‘And it can identify opportunities and improve your brand image and competitive stance in the market.’
Smarten Sentiment Analysis provides a powerful Artificial Intelligence (AI) technique to analyze customer feedback, and understand attitudes about products, events, trends, etc. “Sentiment Analysis can help you solve problems,” says Patel, ‘And it can identify opportunities and improve your brand image and competitive stance in the market.’.
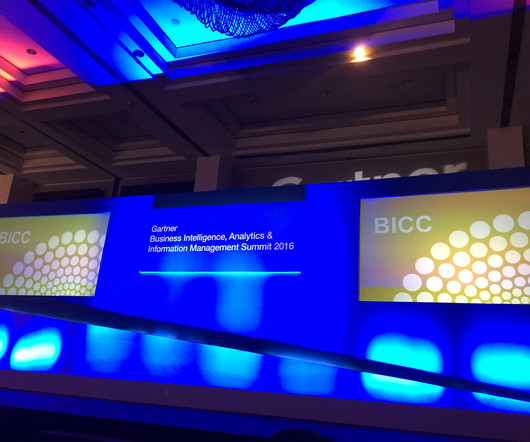
The theme for 2017 was Information & Analytics Leadership: Empowering People with Trusted Data. The 2017 Gartner Summit was the third event I attended and it was impeccably organized and run, with great sound and lighting and informative, exciting presentations. I want to thank those who visited our booth.
The theme for 2017 was Information & Analytics Leadership: Empowering People with Trusted Data. The 2017 Gartner Summit was the third event I attended and it was impeccably organized and run, with great sound and lighting and informative, exciting presentations. I want to thank those who visited our booth.
The theme for 2017 was Information & Analytics Leadership: Empowering People with Trusted Data. The 2017 Gartner Summit was the third event I attended and it was impeccably organized and run, with great sound and lighting and informative, exciting presentations. I want to thank those who visited our booth.
Data exploded and became big. Spreadsheets finally took a backseat to actionable and insightful datavisualizations and interactive business dashboards. The rise of self-service analytics democratized the data product chain. 2) DataDiscovery/Visualization. We all gained access to the cloud.
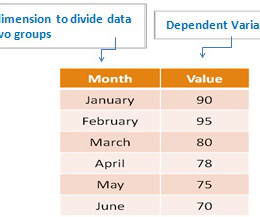
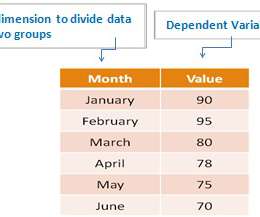
The Paired Sample T Test used to determine whether the mean of a dependent variable and is particularly useful in measuring results before and after a particular event, action, process change, etc. The Smarten approach to datadiscovery is designed as an augmented analytics solution to serve business users.
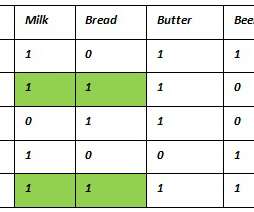
Support: The support of a rule x -> y (where x and y are each items/events etc.) is defined as the proportion of transactions in the data set which contain the item set x as well as y. The Smarten approach to datadiscovery is designed as an augmented analytics solution to serve business users. of transactions.
The Paired Sample T Test used to determine whether the mean of a dependent variable and is particularly useful in measuring results before and after a particular event, action, process change, etc. The Smarten approach to datadiscovery is designed as an augmented analytics solution to serve business users.
Support: The support of a rule x -> y (where x and y are each items/events etc.) is defined as the proportion of transactions in the data set which contain the item set x as well as y. The Smarten approach to datadiscovery is designed as an augmented analytics solution to serve business users. of transactions.
The Paired Sample T Test used to determine whether the mean of a dependent variable and is particularly useful in measuring results before and after a particular event, action, process change, etc. Paired Sample T testing can be applied only to two samples: one measure and one time dimension. About Smarten.
Support: The support of a rule x -> y (where x and y are each items/events etc.) is defined as the proportion of transactions in the data set which contain the item set x as well as y. So, Support (x -> y)= no. of transactions which contain the item set x & y / total no. of transactions.
Every aspect of modern life (personal and business) involves sharing and social interaction, whether one is broadcasting information about a recent family event, posting a picture, asking opinions at work or promoting a new product or event. ’ Original Source – Social Business Intelligence: The Next Big Thing!
Every aspect of modern life (personal and business) involves sharing and social interaction, whether one is broadcasting information about a recent family event, posting a picture, asking opinions at work or promoting a new product or event. ’ Original Source – Social Business Intelligence: The Next Big Thing!
Every aspect of modern life (personal and business) involves sharing and social interaction, whether one is broadcasting information about a recent family event, posting a picture, asking opinions at work or promoting a new product or event. ’ Original Source – Social Business Intelligence: The Next Big Thing!
And quite a few of the Area sales managers in the insurance segment or FMCG feel far and distant from this event. As I write, you and I are also reading the news splattered all over the media, that technology jobs are being reskilled and leading to some job losses. I am using Area sales manager in Insurance as an example.
It is described using methods like drill-down, datadiscovery, data mining, and correlations. To identify the underlying causes of occurrences, diagnostic analytics examines data more closely. It is helpful in figuring out what events and variables led to the result.
And quite a few of the Area sales managers in the insurance segment or FMCG feel far and distant from this event. As I write, you and I are also reading the news splattered all over the media, that technology jobs are being reskilled and leading to some job losses. I am using Area sales manager in Insurance as an example.
And quite a few of the Area sales managers in the insurance segment or FMCG feel far and distant from this event. As I write, you and I are also reading the news splattered all over the media, that technology jobs are being reskilled and leading to some job losses. I am using Area sales manager in Insurance as an example.
Kuber Sharma Director, Product Marketing, Tableau Kristin Adderson August 22, 2023 - 12:11am August 22, 2023 Whether you're a novice data analyst exploring the possibilities of Tableau or a leader with years of experience using VizQL to gain advanced insights—this is your list of key Tableau features you should know, from A to Z.
A few popular companies that offer data wrangling solutions are Trifacta and Datawatch Monarch. Core Data Wrangling Activities. The data wrangling process typically involves the following six core data wrangling activities. This step allows data scientists to get familiar with the data sets. . Discovering.
That way, any anomaly is identified with high accuracy, as it learns from historical trends and patterns: every unexpected event will be notified, and an alert sent. Some more examples of AI applications can be found in various domains: in 2020 we will experience more AI in combination with big data in healthcare.
Table of Contents 1) The Benefits Of DataVisualization 2) Our Top 27 Best DataVisualizations 3) Interactive DataVisualization: What’s In It For Me? 4) Static vs. Animated DataVisualizationData is the new oil? No, data is the new soil.”
This is in contrast to traditional BI, which extracts insight from data outside of the app. According to the 2021 State of Analytics: Why Users Demand Better report by Hanover Research, 77 percent of organizations consider end-user data literacy “very” or “extremely important” in making fast and accurate decisions.
Analytics and datavisualizations have the power to elevate a software product, making it a powerful tool that helps each user fulfill their mission more effectively. Although datadiscovery applications have their place, they’re not designed to seamlessly integrate with an existing application’s workflows. Download Now.
Existing applications did not adequately allow organizations to deliver cost-effective, high-quality interactive, white-labeled/branded datavisualizations, dashboards, and reports embedded within their applications. Embed advanced functionality like self-service, datadiscovery, and administration for external use.
This empowered Brivo’s customers to transform raw data into valuable security intelligence, ultimately strengthening their physical security measures. Logi Symphony’s out-of-the-box features like data joining and multi-platform support further enhanced the solution. Want to learn more? Privacy Policy.
It allows organizations to integrate business-level AI, interactive datavisualizations, dashboards, and reports, thereby enriching the value and engagement of every application. I understand that I can withdraw my consent at any time. Privacy Policy.
Logi Symphony is a powerful embedded business intelligence and analytics software suite that empowers independent software vendors and application teams to embed analytical capabilities and datavisualizations into your SaaS applications. Extend AI’s reach with seamless embedding. Privacy Policy.
In the era of big data, it’s especially important to be mindful of that reality. That’s why today’s smart business leaders are using data-driven storytelling to make an impact on the people around them. Raw Data, Visualizations, and Data Storytelling. Patrick has mastered the art of data storytelling.
We organize all of the trending information in your field so you don't have to. Join 57,000+ users and stay up to date on the latest articles your peers are reading.
You know about us, now we want to get to know you!
Let's personalize your content
Let's get even more personalized
We recognize your account from another site in our network, please click 'Send Email' below to continue with verifying your account and setting a password.


Let's personalize your content