This site uses cookies to improve your experience. To help us insure we adhere to various privacy regulations, please select your country/region of residence. If you do not select a country, we will assume you are from the United States. Select your Cookie Settings or view our Privacy Policy and Terms of Use.
Cookie Settings
Cookies and similar technologies are used on this website for proper function of the website, for tracking performance analytics and for marketing purposes. We and some of our third-party providers may use cookie data for various purposes. Please review the cookie settings below and choose your preference.
Used for the proper function of the website
Used for monitoring website traffic and interactions
Cookie Settings
Cookies and similar technologies are used on this website for proper function of the website, for tracking performance analytics and for marketing purposes. We and some of our third-party providers may use cookie data for various purposes. Please review the cookie settings below and choose your preference.
Strictly Necessary: Used for the proper function of the website
Performance/Analytics: Used for monitoring website traffic and interactions
From a single solution, organizations can embed cost-effective AI, interactive datavisualizations, dashboards, and reports, enhancing the value and engagement of any application RALEIGH, N.C. “Analytics are an essential component of any modern application, but embedding this functionality is not easy.
A BI dashboard — or business intelligence dashboard — is an information management tool that uses datavisualization to display KPIs (key performance indicators) tracked by a business to assess various aspects of performance. They aim at simplifying huge amounts of data, into simpler insights that can been easily understood and used.
A BI dashboard — or business intelligence dashboard — is an information management tool that uses datavisualization to display KPIs (key performance indicators) tracked by a business to assess various aspects of performance. They aim at simplifying huge amounts of data, into simpler insights that can been easily understood and used.
Editors note: This blog was originally published in October 2013, and has been completely revamped and updated for accuracy, relevancy, and comprehensiveness in September 2019 Prior to the 17th century, datavisualization existed mainly in the realm of maps, displaying land markers, cities, roads, and resources.
And in 2022, those awards came early and often for Domo, which won across three key categories: Business Intelligence, Embedded Business Intelligence, and DataDiscovery & Visualization. First, the embedded experience allows them to inject their brand into the platform so that it is an extension of their company.
A BI dashboard — or business intelligence dashboard — is an information management tool that uses datavisualization to display KPIs (key performance indicators) tracked by a business to assess various aspects of performance. They aim at simplifying huge amounts of data, into simpler insights that can been easily understood and used.
A BI dashboard — or business intelligence dashboard — is an information management tool that uses datavisualization to display KPIs (key performance indicators) tracked by a business to assess various aspects of performance. They aim at simplifying huge amounts of data, into simpler insights that can been easily understood and used.
. – February 15, 2023 – insightsoftware , a global provider of reporting, analytics, and performance management solutions, today announced it has been named a winner for Embedded Business Intelligence (BI) in the 2022 Technology Innovation Awards by Dresner Advisory Services.
Data exploded and became big. Spreadsheets finally took a backseat to actionable and insightful datavisualizations and interactive business dashboards. The rise of self-service analytics democratized the data product chain. Suddenly advanced analytics wasn’t just for the analysts. Agile and flexible.
As your business moves toward metrics and measurable results and embraces analytics, it is likely to consider the implementation of augmented analytics across the enterprise. What is Smart DataVisualization? How Does Smart DataVisualization Work? What Can My Business Do with Smart DataVisualization?
As your business moves toward metrics and measurable results and embraces analytics, it is likely to consider the implementation of augmented analytics across the enterprise. What is Smart DataVisualization? How Does Smart DataVisualization Work? What Can My Business Do with Smart DataVisualization?
As your business moves toward metrics and measurable results and embraces analytics, it is likely to consider the implementation of augmented analytics across the enterprise. What is Smart DataVisualization? How Does Smart DataVisualization Work? What Can My Business Do with Smart DataVisualization?
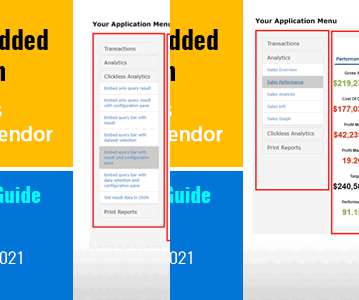
Elegant MicroWeb is pleased to announce that its ElegantJ BI Embedded BI solution has been included as a Representative Vendor in the Gartner Market Guide for EmbeddedAnalytics, published October 4, 2021 (ID G00748546).
Elegant MicroWeb is pleased to announce that its ElegantJ BI Embedded BI solution has been included as a Representative Vendor in the Gartner Market Guide for EmbeddedAnalytics, published October 4, 2021 (ID G00748546).
Elegant MicroWeb is pleased to announce that its ElegantJ BI Embedded BI solution has been included as a Representative Vendor in the Gartner Market Guide for EmbeddedAnalytics, published October 4, 2021 (ID G00748546).
Data analysis tools are software solutions, applications, and platforms that simplify and accelerate the process of analyzing large amounts of data. They enable business intelligence (BI), analytics, datavisualization , and reporting for businesses so they can make important decisions timely.
Introduction Why should I read the definitive guide to embeddedanalytics? But many companies fail to achieve this goal because they struggle to provide the reporting and analytics users have come to expect. The Definitive Guide to EmbeddedAnalytics is designed to answer any and all questions you have about the topic.
With customers now expecting more than ever from analytics, many development teams invested in embeddedanalytics solutions to reduce the workload and time to value for their applications. Scalability : Think of growing data volume and performance here.
By providing these tools, your users can transform their raw data into actionable intelligence, driving data-driven business decisions. This technology tackles the traditional data overload by integrating analytical tools directly within your users’ workflow. However, building this feature in-house wasn’t feasible.
In the era of big data, it’s especially important to be mindful of that reality. That’s why today’s smart business leaders are using data-driven storytelling to make an impact on the people around them. Raw Data, Visualizations, and Data Storytelling. Patrick has mastered the art of data storytelling.
Analytics and datavisualizations have the power to elevate a software product, making it a powerful tool that helps each user fulfill their mission more effectively. Application Imperative: How Next-Gen EmbeddedAnalytics Power Data-Driven Action. The Better Approach: EmbeddedAnalytics.
Embeddedanalytics is a game-changer for software teams developing web-based applications. It seamlessly integrates data insights into existing workflows, boosting user engagement, and enabling real-time decision-making. These software teams understand that the usage of ABI ultimately drives better business outcomes.
In the rapidly-evolving world of embeddedanalytics and business intelligence, one important question has emerged at the forefront: How can you leverage artificial intelligence (AI) to enhance your data analysis?
We organize all of the trending information in your field so you don't have to. Join 57,000+ users and stay up to date on the latest articles your peers are reading.
You know about us, now we want to get to know you!
Let's personalize your content
Let's get even more personalized
We recognize your account from another site in our network, please click 'Send Email' below to continue with verifying your account and setting a password.


Let's personalize your content