This site uses cookies to improve your experience. To help us insure we adhere to various privacy regulations, please select your country/region of residence. If you do not select a country, we will assume you are from the United States. Select your Cookie Settings or view our Privacy Policy and Terms of Use.
Cookie Settings
Cookies and similar technologies are used on this website for proper function of the website, for tracking performance analytics and for marketing purposes. We and some of our third-party providers may use cookie data for various purposes. Please review the cookie settings below and choose your preference.
Used for the proper function of the website
Used for monitoring website traffic and interactions
Cookie Settings
Cookies and similar technologies are used on this website for proper function of the website, for tracking performance analytics and for marketing purposes. We and some of our third-party providers may use cookie data for various purposes. Please review the cookie settings below and choose your preference.
Strictly Necessary: Used for the proper function of the website
Performance/Analytics: Used for monitoring website traffic and interactions
Can Smart DataVisualization Make My Business Smarter? All the data in the world can’t help you improve your business results unless you can sift through it and see it in a way that tells a story – a story that leads you to a conclusion, helps you solve a problem or allows you to see how your business can grow, change and succeed.
Can Smart DataVisualization Make My Business Smarter? All the data in the world can’t help you improve your business results unless you can sift through it and see it in a way that tells a story – a story that leads you to a conclusion, helps you solve a problem or allows you to see how your business can grow, change and succeed.
It enables data sharing and allows the organization to produce fast, dependable insights and improve the value of business analysis across the enterprise, democratizing the use of advanced analytics. Empower users with Smarten Advanced DataDiscovery.
It enables data sharing and allows the organization to produce fast, dependable insights and improve the value of business analysis across the enterprise, democratizing the use of advanced analytics. Empower users with Smarten Advanced DataDiscovery.
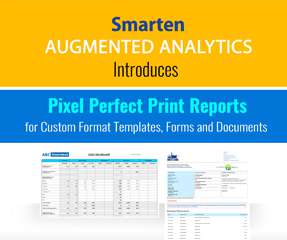
The addition of the Pixel Perfect Print Report features and functionality adds to what is already a robust, user-friendly suite of advanced analytics tools, designed for business users to engender data literacy and digital transformation within the business environment.
The addition of the Pixel Perfect Print Report features and functionality adds to what is already a robust, user-friendly suite of advanced analytics tools, designed for business users to engender data literacy and digital transformation within the business environment.
Data exploded and became big. Spreadsheets finally took a backseat to actionable and insightful datavisualizations and interactive business dashboards. The rise of self-service analytics democratized the data product chain. 2) DataDiscovery/Visualization. We all gained access to the cloud.
We had a great response, especially with our Smarten Advanced DataDiscovery with self serve data prep, smart visualization and plug n’ play predictive analytics. Our team offered demonstrations of the ElegantJ BI solution at the booth and I am happy to say that our demos were very well received.
We had a great response, especially with our Smarten Advanced DataDiscovery with self serve data prep, smart visualization and plug n’ play predictive analytics. Our team offered demonstrations of the ElegantJ BI solution at the booth and I am happy to say that our demos were very well received.
Blockchain: Separating the Magic From the Reality for Data and Analytics with Ted Friedman. The Closing Session Keynote on digital transformation by Partha Iyengar. We had a great response, especially with our Smarten Advanced DataDiscovery with self serve data prep, smart visualization and plug n’ play predictive analytics.
In a world dominated by data, it’s more important than ever for businesses to understand how to extract every drop of value from the raft of digital insights available at their fingertips. You can view business intelligence as an extremely powerful datadiscovery tool that is an extension of your fast thinking mind.
With people working cohesively towards a common goal, departments can use management reporting datadiscoveries to collaborate on specific projects or initiatives, catalyzing success in a number of key areas. 6) Go digital! An important best practice for management reporting is to ditch the paper-based reports and go digital.
In our data-rich age, understanding how to analyze and extract true meaning from the digital insights available to our business is one of the primary drivers of success. Despite the colossal volume of data we create every day, a mere 0.5% is actually analyzed and used for datadiscovery , improvement, and intelligence.
Gartner has stated that “artificial intelligence in the form of automated things and augmented intelligence is being used together with IoT, edge computing and digital twins.” Such innovations offer the ability to transfer data over a network, creating valuable experiences for both the consumer and the business itself.
Accessibility: With SaaS, businesses have the mobility of accessing applications from any digital device and location, making it especially convenient for mobile platforms. This means that your business’s data is available and secure regardless of a data breach or system failure. The revolution is here, and it’s digital.
Quick data processing and the possibility to access data on-the-go, no matter the location, and with the only requirement of an Internet connection, makes mobile analytics an added value to businesses across the globe. This data analytics buzzword is somehow a déjà-vu. Augmented Analytics.
Business leaders, developers, data heads, and tech enthusiasts – it’s time to make some room on your business intelligence bookshelf because once again, datapine has new books for you to add. We have already given you our top datavisualization books , top business intelligence books , and best data analytics books.
Data is extremely important in today’s digital-first world, as it has always been. The Data Analytics Lifecycle is a diagram that depicts these steps for professionals that are involved in data analytics projects. Phase 1: DataDiscovery and Formation To begin, there must be a clear objective.
Since we live in a digital age, where datadiscovery and big data simply surpass the traditional storage and manual implementation and manipulation of business information, companies are searching for the best possible solution for handling data. It is evident that the cloud is expanding. It’s completely free!
And just having lots of data isn’t enough – what’s important is to be able to focus on what’s important. New intelligent datadiscovery technologies, powered by machine learning, can help you get to the heart of the problem faster: what’s new and unusual? Good datavisualization is vital.
1) What Is DataDiscovery? 2) Why is DataDiscovery So Popular? 3) DataDiscovery Tools Attributes. 5) How To Perform Smart DataDiscovery. 6) DataDiscovery For The Modern Age. We live in a time where data is all around us. So, what is datadiscovery?
At present, 53% of businesses are in the process of adopting big data analytics as part of their core business strategy – and it’s no coincidence. To win on today’s information-rich digital battlefield, turning insight into action is a must, and online data analysis tools are the very vessel for doing so.
Table of Contents 1) The Benefits Of DataVisualization 2) Our Top 27 Best DataVisualizations 3) Interactive DataVisualization: What’s In It For Me? 4) Static vs. Animated DataVisualizationData is the new oil? No, data is the new soil.”
This is in contrast to traditional BI, which extracts insight from data outside of the app. According to the 2021 State of Analytics: Why Users Demand Better report by Hanover Research, 77 percent of organizations consider end-user data literacy “very” or “extremely important” in making fast and accurate decisions.
Analytics and datavisualizations have the power to elevate a software product, making it a powerful tool that helps each user fulfill their mission more effectively. Although datadiscovery applications have their place, they’re not designed to seamlessly integrate with an existing application’s workflows. Download Now.
Existing applications did not adequately allow organizations to deliver cost-effective, high-quality interactive, white-labeled/branded datavisualizations, dashboards, and reports embedded within their applications. Embed advanced functionality like self-service, datadiscovery, and administration for external use.
It allows organizations to integrate business-level AI, interactive datavisualizations, dashboards, and reports, thereby enriching the value and engagement of every application. I understand that I can withdraw my consent at any time.
This empowered Brivo’s customers to transform raw data into valuable security intelligence, ultimately strengthening their physical security measures. Logi Symphony’s out-of-the-box features like data joining and multi-platform support further enhanced the solution. Want to learn more?
Logi Symphony is a powerful embedded business intelligence and analytics software suite that empowers independent software vendors and application teams to embed analytical capabilities and datavisualizations into your SaaS applications. Extend AI’s reach with seamless embedding.
In the era of big data, it’s especially important to be mindful of that reality. That’s why today’s smart business leaders are using data-driven storytelling to make an impact on the people around them. Raw Data, Visualizations, and Data Storytelling. Patrick has mastered the art of data storytelling.
We organize all of the trending information in your field so you don't have to. Join 57,000+ users and stay up to date on the latest articles your peers are reading.
You know about us, now we want to get to know you!
Let's personalize your content
Let's get even more personalized
We recognize your account from another site in our network, please click 'Send Email' below to continue with verifying your account and setting a password.


Let's personalize your content