This site uses cookies to improve your experience. To help us insure we adhere to various privacy regulations, please select your country/region of residence. If you do not select a country, we will assume you are from the United States. Select your Cookie Settings or view our Privacy Policy and Terms of Use.
Cookie Settings
Cookies and similar technologies are used on this website for proper function of the website, for tracking performance analytics and for marketing purposes. We and some of our third-party providers may use cookie data for various purposes. Please review the cookie settings below and choose your preference.
Used for the proper function of the website
Used for monitoring website traffic and interactions
Cookie Settings
Cookies and similar technologies are used on this website for proper function of the website, for tracking performance analytics and for marketing purposes. We and some of our third-party providers may use cookie data for various purposes. Please review the cookie settings below and choose your preference.
Strictly Necessary: Used for the proper function of the website
Performance/Analytics: Used for monitoring website traffic and interactions
DataVisualization. Did you know visualization has been in use since (and well before that as well) 1824 AD to develop an Egyptian map – the Turin Papyrus Map. With the overwhelming volume and rate at which data grows, it is almost impossible to do it without visual help. Creating Good Visualizations.
Over the decade’s Hospitality Industry wings expand to the new horizon due to the widespread usage of mobiles which allows customers to plan the vacation & visualize the ambiance at their fingertips. Text analytics helps to draw the insights from the unstructured data. . Decoding online reviews through analytics.
“By visualizinginformation, we turn it into a landscape that you can explore with your eyes. A sort of information map. And when you’re lost in information, an information map is kind of useful.” – David McCandless. 90% of the information transmitted to the brain is visual. Did you know?
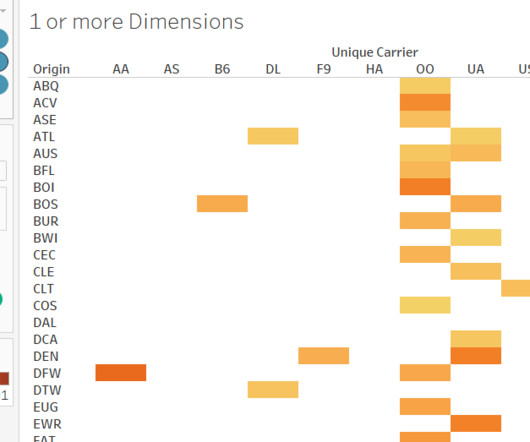
Heat and Tree Maps We are going to look at two important visualizations which are used in many different fields for analysis. Heat Maps In these visualizations, the color shade of areas varies as per the values in the data. They are great for visualizing statistical data as well.
Sales Analytics is used to determine the success of the previous sales drive and forecast in addition to determine how future sales will fare. Over the years, the rise of informationtechnology helped in the innovation of sales enablement solutions and software products.
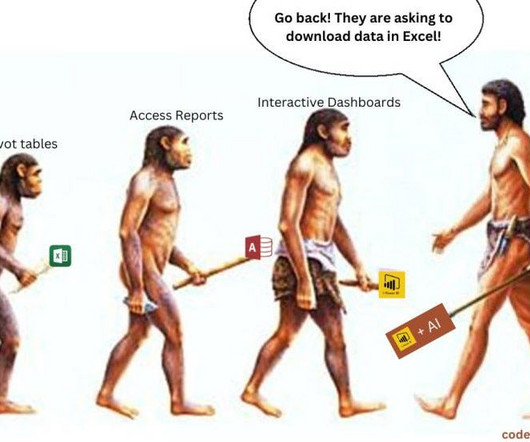
Why learning Excel is important for a career working with data Image used with permission from Hemanand Vadivel, Co-founder codebasics.io This article was first published in The Data Pub Newsletter on Substack on January 5, 2023. Since I hold a degree in computer science/informationtechnology, it is assumed that I already know Excel.
Over the decade’s Hospitality Industry wings expand to the new horizon due to the widespread usage of mobiles which allows customers to plan the vacation & visualize the ambiance at their fingertips. Text analytics helps to draw the insights from the unstructured data. DECODING ONLINE REVIEWS THROUGH ANALYTICS.
“Being a Tableau Ambassador allows me to help others learn Tableau and empower them with analytics and datavisualization skills. Gurpreet Singh is DataAnalytics & Visualization lead, certified Tableau Desktop specialist and analytics content creator with 15+ years of experience in InformationTechnology.
With a little bit of planning, your strengths in working with data, analytical and logical skills, and knowledge of basic economics can help you excel in this position. Technical Skills: A few technical skills are necessary, especially within IT: SQL: Learn to query the databases to get some data and examine it.
. > Keep reading… Career development 1) Data Analyst in 2024: Skills, Education, and Career Pathways Unveiled by Nilimesh Halder, PhD In the ever-evolving world of technology and business, data analysts have become crucial for translating numbers into actionable insights. This keeps our publication going ;) Thanks folks!
Visually representation of AI mimics the human world but does not understand it. Prompt: “Computer on the desk, data diagrams on the screen” — Source: Bing AI image generator. You are using the right tools to interpret data models and data correctly to extract business intelligence. AGI hasn’t been achieved yet.
Tableau is currently one of the most powerful and fastest-growing business intelligence and visualanalytics platforms in the industry. Tableau is helping users transform any variety of data into actionable insights that are changing the way businesses are operating. Tableau Certification Benefits. About Techcanvass.
“Being a Tableau Ambassador allows me to help others learn Tableau and empower them with analytics and datavisualization skills. Gurpreet Singh is DataAnalytics & Visualization lead, certified Tableau Desktop specialist and analytics content creator with 15+ years of experience in InformationTechnology.
“Being a Tableau Ambassador allows me to help others learn Tableau and empower them with analytics and datavisualization skills. Gurpreet Singh is DataAnalytics & Visualization lead, certified Tableau Desktop specialist and analytics content creator with 15+ years of experience in InformationTechnology.
These insightful visualizations were done in Tableau. Techcanvass is an InformationTechnology certifications training Organization for professionals. Find out more about Tableau in this article. About Techcanvass. It offers internationally recognized certifications in the fields of Project Management and Business Analysis.
The engineering team he leads is responsible for building and maintaining Microsoft Azure, Dynamics 365, Windows/Windows Server, HoloLens, Visual Studio/Visual Studio Code, GitHub, SQL Server, and Power BI. . Lydia is a seeker of input through information, opinions and experiences. Follow Gabor A Pinter on LinkedIn.
Entry Certificate in Business Analysis (ECBA) You can read many articles on DataAnalytics in this Business Analysis blog. Requirements Analysis and Modelling: Learning tools & techniques for elicitation, requirements specifications, visual modelling and collaboration. Also, do practice and visualize.
However, understanding technology and working with software tools is a core competency. In other places SQL, Excel, as well as datavisualization are often important. More technical positions may require specific degrees such as computer engineering or data science. What is SQL and how is it used?
Either a strong foundation in business or in informationtechnology is required. Top 15 Business Analyst Career Path with their Salaries You must first prepare for your career as a business analyst before you can move forward. You have various employment options to choose from as you work toward becoming a business analyst.
We organize all of the trending information in your field so you don't have to. Join 57,000+ users and stay up to date on the latest articles your peers are reading.
You know about us, now we want to get to know you!
Let's personalize your content
Let's get even more personalized
We recognize your account from another site in our network, please click 'Send Email' below to continue with verifying your account and setting a password.


Let's personalize your content