This site uses cookies to improve your experience. To help us insure we adhere to various privacy regulations, please select your country/region of residence. If you do not select a country, we will assume you are from the United States. Select your Cookie Settings or view our Privacy Policy and Terms of Use.
Cookie Settings
Cookies and similar technologies are used on this website for proper function of the website, for tracking performance analytics and for marketing purposes. We and some of our third-party providers may use cookie data for various purposes. Please review the cookie settings below and choose your preference.
Used for the proper function of the website
Used for monitoring website traffic and interactions
Cookie Settings
Cookies and similar technologies are used on this website for proper function of the website, for tracking performance analytics and for marketing purposes. We and some of our third-party providers may use cookie data for various purposes. Please review the cookie settings below and choose your preference.
Strictly Necessary: Used for the proper function of the website
Performance/Analytics: Used for monitoring website traffic and interactions
In fact, 90% of the worlds data has been created in just the past two years, underscoring the rapid pace of data generation. However, the explosion of data has […] The post Mastering DataVisualizations for Better Understanding appeared first on DATAVERSITY.
Dataanalytics technology has become an integral part of organizational management. There are a lot of different ways that big data can help companies streamline certain processes and resolve various challenges that they face. The advent of datavisualization has made it easier than ever.
There are countless examples of big data transforming many different industries. It can be used for something as visual as reducing traffic jams, to personalizing products and services, to improving the experience in multiplayer video games. We would like to talk about datavisualization and its role in the big data movement.
While the collection and processing of data involves a lot of technology and expertise, creating a visual representation of the data, which can be read and understood by one and all, also requires an intuitive excellence. Such excellence predominantly is needed to select visualization formats for a specific set of sample data.
However, computerization in the digital age creates massive volumes of data, which has resulted in the formation of several industries, all of which rely on data and its ever-increasing relevance. Dataanalytics and visualization help with many such use cases. It is the time of big data.
Big data is large chunks of information that cannot be dealt with by traditional data processing software. Big dataanalytics is finding applications in eLearning. By analyzing big data, Edutech businesses discover interesting ways to revolutionize learning as we know it.
Learn how DirectX visualization can improve your study and assessment of different trading instruments for maximum productivity and profitability. Analytics technology has become an invaluable aspect of modern financial trading. Luckily, there are a few analytics optimization strategies you can use to make life easy on your end.
Dataanalytics has accompanied me for 15 years already. I started my career as a data analyst in a controlling department immediately following my graduation from the University of West Bohemia; I now work as a data scientist providing consultancy services for a range of different fields.
To empower business users and allow them to achieve goals and contribute to the bottom line, you provide advanced analytics and smart datavisualization tools in an easy-to-use environment that encourages user adoption and report and data sharing.
To empower business users and allow them to achieve goals and contribute to the bottom line, you provide advanced analytics and smart datavisualization tools in an easy-to-use environment that encourages user adoption and report and data sharing.
To empower business users and allow them to achieve goals and contribute to the bottom line, you provide advanced analytics and smart datavisualization tools in an easy-to-use environment that encourages user adoption and report and data sharing.
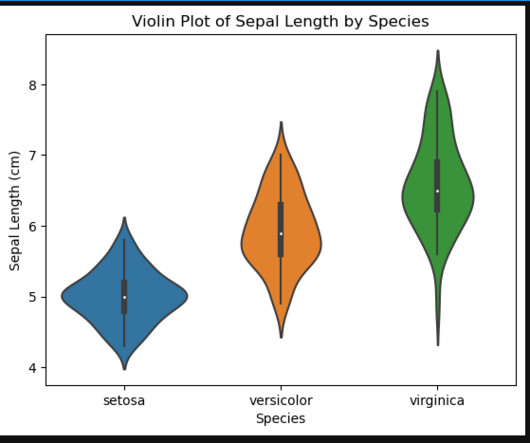
Introduction Datavisualization is an essential skill for anyone who wants to explore and understand large datasets. One of the most popular libraries for datavisualization in Python is Seaborn. In this article, we will focus on understanding how to use Seaborn’s violin plots to visualize the Iris dataset.
Key components of Big Dataanalytics [own elaboration] Big Dataanalytics refers to advanced techniques used to analyze massive, diverse, and complex data sets. At its core, Big DataAnalytics seeks to uncover patterns, correlations, and trends that traditional methods mightmiss.
Previously, we discussed the top 19 big data books you need to read, followed by our rundown of the world’s top business intelligence books as well as our list of the best SQL books for beginners and intermediates. Datavisualization, or ‘data viz’ as it’s commonly known, is the graphic presentation of data.
Increasingly, though, brands and businesses of all sizes expect their legal representatives to leverage and report out – data the same way as the rest of the company. As a result, big law firms have implemented dataanalytics a top-of-mind priority for in-house attorneys. What is Legal Analytics?
Business reporting has been around for a long time but the tools and techniques of business intelligence have refined over time and now with the recent popularity of data driven business approach, data has been identified as the most valuable asset of a business and dataanalytics and reporting has finally found a key place in the business world.
One area that no business should overlook is datavisualization or the graphic representation of numerical business information. Businesses often produce many reports and data sets, but some companies are unsure about whether […].
When you’re presenting dataanalytics or any technical information to a non-technical audience, it can be difficult. If you’re someone who understands dataanalytics well or is highly technical, it can be especially challenging to know how to make your presentation work for the needs of an audience which is different from you.
According to Forbes, Almost eighty-thousand scientific studies attest that visual images promote retention. Graphs, charts with colors, lines and shapes can often tell a story and communicate issues, challenges and opportunities in a business environment. Lets […]
It is one of the biggest reasons that the market for big data is projected to be worth $273 billion by 2026. Companies are finding more creative ways to employ dataanalytics to improve their business intelligence strategies. One of them is by using layered navigation.
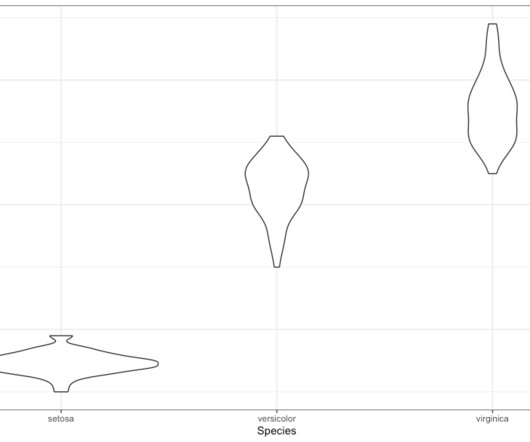
Violin plots are a visualization technique used to display the distribution of a continuous variable across different levels of a categorical variable. Getting Started: First, we need to install and load the ggplot2 package, which is an extension of the base R graphics system that allows for more flexible and customizable visualizations.
If you occasionally run business stands in fairs, congresses and exhibitions, business stands designers can incorporate business intelligence to aid in better business and client data collection. Business intelligence tools can include data warehousing, datavisualizations, dashboards, and reporting.
Nowadays, terms like ‘DataAnalytics,’ ‘DataVisualization,’ and ‘Big Data’ have become quite popular. In this modern age, each business entity is driven by data. Dataanalytics are now very crucial whenever there is a decision-making process involved. Perks Associated with Big Data.
Facility managers can now use new technologies, such as datavisualization dashboards, to view the performance of their building. They can use the data to gather insights and spot trends. Building operators can even use charts and graphs to make datavisual. Then, use the data to identify problem areas.
Big data is changing the nature of email marketing. Although dataanalytics has played a vital role in split-testing campaign variables, there are other benefits as well. One way that big data is helping in email marketing is improving team collaboration. Big Data Plays Vital Role in Streamlining Email Marketing.
Why Should I Care About Smart Visualization and Advanced Data Discovery? Are you up on the latest analytics lingo or do you still think smart visualization is some kind of artificial eyeball? The Smarten approach to dataanalytics will get you there. Here’s the thing.
Why Should I Care About Smart Visualization and Advanced Data Discovery? Are you up on the latest analytics lingo or do you still think smart visualization is some kind of artificial eyeball? The Smarten approach to dataanalytics will get you there. Here’s the thing.
Why Should I Care About Smart Visualization and Advanced Data Discovery? Are you up on the latest analytics lingo or do you still think smart visualization is some kind of artificial eyeball? The Smarten approach to dataanalytics will get you there. Here’s the thing.
“By visualizing information, we turn it into a landscape that you can explore with your eyes. 90% of the information transmitted to the brain is visual. Concerning professional growth, development, and evolution, using data-driven insights to formulate actionable strategies and implement valuable initiatives is essential.
As a data analyst, you will learn several technical skills that data analysts need to be successful, including: Programming skills. Datavisualization capability. Data Mining skills. Data wrangling ability. Not only is this career in demand, but growing. Machine learning knowledge.
If you’re using Tableau, but want to get more out of that powerful datavisualization tool, get this ebook. You’ll unlock the secrets to powerful features you didn’t know existed, for in-depth dataanalytics and insight your boss will admire. It will transform you into a Tableau power user.
DataAnalytics Can Transform Users to Citizen Data Scientists! The term ‘dataanalytics can seem daunting to the average business user. Isn’t analytics something that is the sole domain of data scientists? No, actually it is not!
DataAnalytics Can Transform Users to Citizen Data Scientists! The term ‘dataanalytics can seem daunting to the average business user. Isn’t analytics something that is the sole domain of data scientists? No, actually it is not!
DataAnalytics Can Transform Users to Citizen Data Scientists! The term ‘dataanalytics can seem daunting to the average business user. Isn’t analytics something that is the sole domain of data scientists? No, actually it is not!
It can connect any data source, although the better your source, the better the results will be. Another key benefit is that it allows companies to create datavisualizations! Another cloud-based software with an easy-to-use interface, Looker provides not only dataanalytics and management, but also business intelligence tools.
To make business decisions with spreadsheets, the finance team has to pore over thousands of rows of data. Analyzing company data lying in cumbersome spreadsheets becomes a chore so is often neglected.
In a very short period of time, may be over a last decade, dataanalytics has went through several big transformations. Second, we all witnessed the emergence of Big Dataanalytics, driven partly by digitization and partly by massively improving storage and processing capabilities. Initially, it became digitized.
Everyone has to manage raw data at one point or another; yet, not everybody stores it in a way that’s useful for further analysis or comparison to other data sets. As data sets become bigger, it becomes harder to visualize information. Draw a chart highlighting each endpoint in your data.
Marketers need to rely heavily on big data technology to reach customers more effectively. Big data technology isn’t just important for making better insights. Visual marketing dashboards are prime examples of using big data effectively in marketing. Big data has been very important for modern marketing.
Citizen Data Scientists are Not Born, They are Created! Dataanalytics software used to be reserved for data scientists, analysts and IT staff but not today! DataAnalytics is not just for data scientists! Original Post: Self-Serve DataAnalytics Can Work for You!
Citizen Data Scientists are Not Born, They are Created! Dataanalytics software used to be reserved for data scientists, analysts and IT staff but not today! DataAnalytics is not just for data scientists! Original Post: Self-Serve DataAnalytics Can Work for You!
Citizen Data Scientists are Not Born, They are Created! Dataanalytics software used to be reserved for data scientists, analysts and IT staff but not today! DataAnalytics is not just for data scientists! Original Post: Self-Serve DataAnalytics Can Work for You!
Dataanalytics technology has changed many aspects of the modern workplace. A growing number of companies are using data to make more informed hiring decisions , track payroll issues and resolve internal problems. Keep reading to learn more about the benefits of a data-driven approach to conducting employee performance reviews.
DataAnalytics and Business Analytics: An Integrated Approach! What’s the difference between business analytics and dataanalytics? DataAnalytics is a process that is used as part of the Business Analytics environment to monitor and manage the business.
We organize all of the trending information in your field so you don't have to. Join 57,000+ users and stay up to date on the latest articles your peers are reading.
You know about us, now we want to get to know you!
Let's personalize your content
Let's get even more personalized
We recognize your account from another site in our network, please click 'Send Email' below to continue with verifying your account and setting a password.


Let's personalize your content