This site uses cookies to improve your experience. To help us insure we adhere to various privacy regulations, please select your country/region of residence. If you do not select a country, we will assume you are from the United States. Select your Cookie Settings or view our Privacy Policy and Terms of Use.
Cookie Settings
Cookies and similar technologies are used on this website for proper function of the website, for tracking performance analytics and for marketing purposes. We and some of our third-party providers may use cookie data for various purposes. Please review the cookie settings below and choose your preference.
Used for the proper function of the website
Used for monitoring website traffic and interactions
Cookie Settings
Cookies and similar technologies are used on this website for proper function of the website, for tracking performance analytics and for marketing purposes. We and some of our third-party providers may use cookie data for various purposes. Please review the cookie settings below and choose your preference.
Strictly Necessary: Used for the proper function of the website
Performance/Analytics: Used for monitoring website traffic and interactions
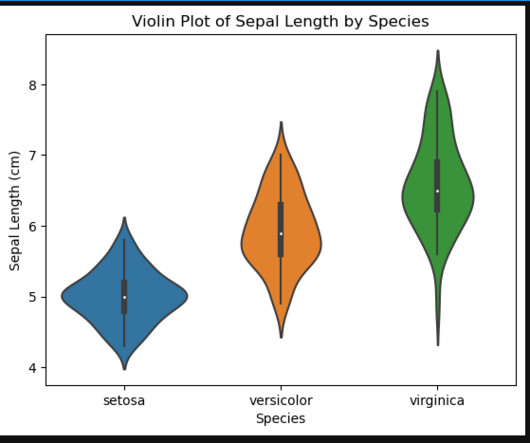
Introduction Datavisualization is an essential skill for anyone who wants to explore and understand large datasets. One of the most popular libraries for datavisualization in Python is Seaborn. In this article, we will focus on understanding how to use Seaborn’s violin plots to visualize the Iris dataset.
Augmented Analytics Tools are designed with enabling technologies like machine learning and natural language processing (NLP) to make the tools easier for business users to leverage and streamline and simplify the process of self-serve data preparation, smart datavisualization and assisted predictive modeling.
Augmented Analytics Tools are designed with enabling technologies like machine learning and natural language processing (NLP) to make the tools easier for business users to leverage and streamline and simplify the process of self-serve data preparation, smart datavisualization and assisted predictive modeling.
Augmented Analytics Tools are designed with enabling technologies like machine learning and natural language processing (NLP) to make the tools easier for business users to leverage and streamline and simplify the process of self-serve data preparation, smart datavisualization and assisted predictive modeling.
Whether you seek to boost your career, future-proof your skills, or tap into growing demand for dataanalytics, here are 5 reasons why Power BI might be your best move yet. Here’s a brief comparison: Tableau: For datavisualization specialists, Tableau is more preferred.
However, the data was essentially stored in old copies of the paper magazine, not a format that was conducive to delivering insights to their target audience. (3) The right product manager We’ve helped launch data products in many industries including healthcare, education, insurance, advertising and market research. Just kidding!
Learning Data Analysis Techniques Data scientists need to be proficient in data manipulation, data cleaning, and datavisualization. Additionally, it is beneficial to have a working knowledge of SQL, as it is widely used for querying and managing databases.
This is one of the most important dataanalytics techniques as it will shape the very foundations of your success. This is one of the most important dataanalytics techniques as it will shape the very foundations of your success. Harvest your data. A dataanalytics methodology you can count on.
With ‘big data’ transcending one of the biggest business intelligence buzzwords of recent years to a living, breathing driver of sustainable success in a competitive digital age, it might be time to jump on the statistical bandwagon, so to speak. of all data is currently analyzed and used. click for book source**.
We all know that data is becoming more and more essential for businesses, as the volume of data keeps growing. Dresner reported that nearly 97% of respondents in their Big DataAnalytics Market Study consider Big Data to be either important or critical to their businesses.
AI can automate the tedious process of data cleaning, identifying outliers, and normalizing data. Data Analysis : AI powered tools can swiftly identify patterns, correlations, and trends, which would take humans much longer to analyze. Prebuilt APIs: Vision, Natural Language, and Translation APIs for quick deployment.
To simplify things, you can think of back-end BI skills as more technical in nature and related to building BI platforms, like online datavisualization tools. Front-end analytical and business intelligence skills are geared more towards presenting and communicating data to others. b) If You’re Already In The Workforce.
Certified Business Analysts are now taking up roles with a mix of business and dataanalytics like “Business Data Analyst” or “Business Analytics Professional”. In this post, we’ll go over some of the most important data analysis skills for becoming a business data analyst. DataVisualization.
In a data-driven age, modern organizations need access to advanced dataanalytics solutions to help them improve the business in a wealth of key areas—Salesforce is one of those solutions. As humans, we have an affinity for visual information as our brains process it far more effectively than text-based data alone.
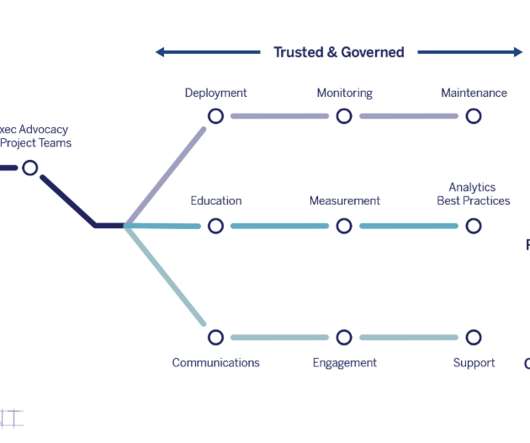
Through understanding the process of commitment to change—in conjunction with Tableau Blueprint—leaders can effectively gain buy-in, ensure a successful implementation of Tableau for modern analytics, and secure their digital transformation. Next, we focus on how best to implement this vision. We have a vision and change is needed.”.
Through understanding the process of commitment to change—in conjunction with Tableau Blueprint—leaders can effectively gain buy-in, ensure a successful implementation of Tableau for modern analytics, and secure their digital transformation. Next, we focus on how best to implement this vision. We have a vision and change is needed.”.
Through understanding the process of commitment to change—in conjunction with Tableau Blueprint—leaders can effectively gain buy-in, ensure a successful implementation of Tableau for modern analytics, and secure their digital transformation. Next, we focus on how best to implement this vision. We have a vision and change is needed.”.
Without big dataanalytics, companies are blind and deaf, wandering out onto the Web like deer on a freeway. Companies that use dataanalytics are five times more likely to make faster decisions, based on a survey conducted by Bain & Company. Geoffrey Moore, Author of Crossing the Chasm & Inside the Tornado.
When you think of big data, you usually think of applications related to banking, healthcare analytics , or manufacturing. After all, these are some pretty massive industries with many examples of big dataanalytics, and the rise of business intelligence software is answering what data management needs.
If you don’t have the vision or don’t know what to do with it, you’ll find yourself shooting in the dark – and that is detrimental to the growth and evolution of any business, regardless of size or sector. Moreover, 57% of enterprise organizations currently employ a chief data officer, another study conducted by MicroStrategy.
yr – $185K/yr Full-time About the job Description Amazons Global Risk Management & Claims team is seeking a highly skilled and detail-oriented Business Analyst with a robust background in economic theory, auto claims management, and dataanalytics. Strong knowledge of datavisualization tools (e.g.,
Sessions will cover how to connect best practices in governance with ethical artificial intelligence (AI) and ways to immerse yourself in the open subsurface data universe (OSDU) conversation and be part of an open future. Product Training and Demos: Build up your skills with TIBCO and ibi products.
At present, 53% of businesses are in the process of adopting big dataanalytics as part of their core business strategy – and it’s no coincidence. To win on today’s information-rich digital battlefield, turning insight into action is a must, and online data analysis tools are the very vessel for doing so.
If you customize or build enterprise dashboards to your specific needs and preferences, you will be able to interact with your data in a way that will expand your vision more than you ever thought possible. The Future Of Data Presentation. Switching between different data sources and tools to create charts.
DataAnalytics. DataAnalytics is a game-changing skill to be mastered in 2022. A lot of actionable firms do not make any significant decisions without the data, numbers, and stats. Dataanalytics allows you to collect and organize data that helps you use it in future marketing campaigns.
Visualization of data analyses can make or break how the analyses are understood. Good datavisualization is vital. It’s not that any of these concepts are new – but what is new is that the technology has finally caught up with the vision of information for all. Data analyses can improve lives. Absolutely.
. “The Gartner Data & Analytics Summit attracts the leading minds of the analytical community, including information architects, CAOs, CDOs, data analysts and executives from many functional disciplines,” says Patel.
. “The Gartner Data & Analytics Summit attracts the leading minds of the analytical community, including information architects, CAOs, CDOs, data analysts and executives from many functional disciplines,” says Patel.
. “The Gartner Data & Analytics Summit attracts the leading minds of the analytical community, including information architects, CAOs, CDOs, data analysts and executives from many functional disciplines,” says Patel.
Without real-time insight into their data, businesses remain reactive, miss strategic growth opportunities, lose their competitive edge, fail to take advantage of cost savings options, don’t ensure customer satisfaction… the list goes on. Rely on interactive datavisualizations.
Provide easy-to-use tools that allow for simple search analytics in a Google-type environment and will make it easier for reluctant business users to embrace your new BI solution and develop new dataanalytics skills they can use for fact-based decisions.
Provide easy-to-use tools that allow for simple search analytics in a Google-type environment and will make it easier for reluctant business users to embrace your new BI solution and develop new dataanalytics skills they can use for fact-based decisions.
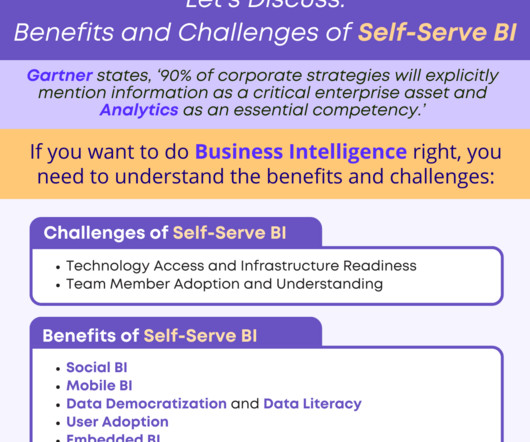
By engaging in Social BI, your team can champion data sharing, collaborate on creative ways to analyze data and make quick work of dataanalytics, with tools that allow the user to ‘like’, ‘share’ and leverage other social tools and networking techniques.
By engaging in Social BI, your team can champion data sharing, collaborate on creative ways to analyze data and make quick work of dataanalytics, with tools that allow the user to ‘like’, ‘share’ and leverage other social tools and networking techniques.
By engaging in Social BI, your team can champion data sharing, collaborate on creative ways to analyze data and make quick work of dataanalytics, with tools that allow the user to ‘like’, ‘share’ and leverage other social tools and networking techniques.
This is in contrast to traditional BI, which extracts insight from data outside of the app. According to the 2021 State of Analytics: Why Users Demand Better report by Hanover Research, 77 percent of organizations consider end-user data literacy “very” or “extremely important” in making fast and accurate decisions.
In the era of big data, it’s especially important to be mindful of that reality. That’s why today’s smart business leaders are using data-driven storytelling to make an impact on the people around them. Raw Data, Visualizations, and Data Storytelling. Patrick has mastered the art of data storytelling.
When your customers deliver analytics and reporting, the datavisualization experience should be a memorable one. Without embedded analytics your users will lack the context behind their raw data to properly explain the story and answer key stakeholder questions on the fly. Just a Story, or The Truth?
A data pipeline is a series of processes that move raw data from one or more sources to one or more destinations, often transforming and processing the data along the way. These pipelines help organizations maintain data quality and support informed decision-making across different domains.
In particular, we are regularly asked to tell stories with data; the rest of this article focuses on how we can optimize our data storytelling. Making your DataVisual “Datavisualization helps to bridge the gap between numbers and words.” – Brie E. We bring this all together in the presentation we give.
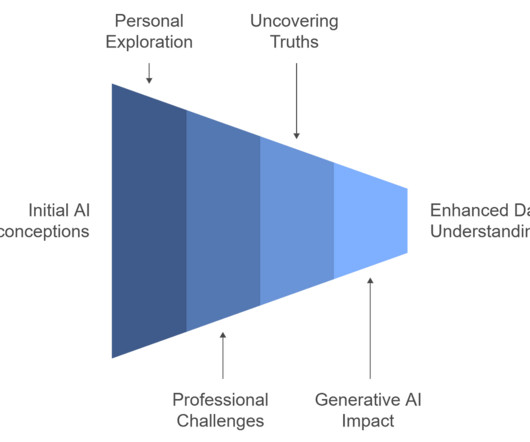
Insights from AI Cowboys Navigating the Future of DataAnalytics Discover how dataanalytics and generative AI converge, enhancing business decision-making and driving growth in this innovative era. Now we’re talking about massive databases, real-time analytics, and more. That was me not long ago.
Protect Your Application with These 7 Hallmarks of a Secure Analytics Solution. What Story Is Your Data Telling? Analytics and datavisualizations have the power to elevate a software product, such that it takes on a powerful new role in the lives of its users. 16 DataVisualizations to Thrill Your Customers.
This was bolstered by insightsoftware’s acquisition of Dundas DataVisualization, Inc., adding deeper functionality that has strengthened Logi’s self-service dataanalytics and visualizations. We’ve made several acquisitions in the embedded analytics family recently, including Izenda and Exago.
Analytics and datavisualizations have the power to elevate a software product, making it a powerful tool that helps each user fulfill their mission more effectively. The Definitive Guide to Embedded Analytics. Logi Analytics. Download Now. To learn more about Logi, get in touch for a free, no-obligation demo.
We organize all of the trending information in your field so you don't have to. Join 57,000+ users and stay up to date on the latest articles your peers are reading.
You know about us, now we want to get to know you!
Let's personalize your content
Let's get even more personalized
We recognize your account from another site in our network, please click 'Send Email' below to continue with verifying your account and setting a password.


Let's personalize your content