This site uses cookies to improve your experience. To help us insure we adhere to various privacy regulations, please select your country/region of residence. If you do not select a country, we will assume you are from the United States. Select your Cookie Settings or view our Privacy Policy and Terms of Use.
Cookie Settings
Cookies and similar technologies are used on this website for proper function of the website, for tracking performance analytics and for marketing purposes. We and some of our third-party providers may use cookie data for various purposes. Please review the cookie settings below and choose your preference.
Used for the proper function of the website
Used for monitoring website traffic and interactions
Cookie Settings
Cookies and similar technologies are used on this website for proper function of the website, for tracking performance analytics and for marketing purposes. We and some of our third-party providers may use cookie data for various purposes. Please review the cookie settings below and choose your preference.
Strictly Necessary: Used for the proper function of the website
Performance/Analytics: Used for monitoring website traffic and interactions
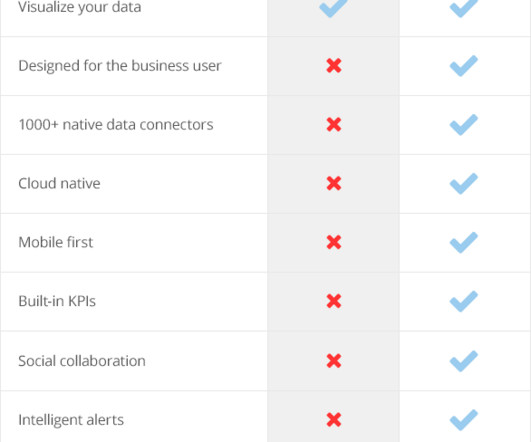
To empower business users and allow them to achieve goals and contribute to the bottom line, you provide advanced analytics and smart datavisualization tools in an easy-to-use environment that encourages user adoption and report and data sharing.
To empower business users and allow them to achieve goals and contribute to the bottom line, you provide advanced analytics and smart datavisualization tools in an easy-to-use environment that encourages user adoption and report and data sharing.
To empower business users and allow them to achieve goals and contribute to the bottom line, you provide advanced analytics and smart datavisualization tools in an easy-to-use environment that encourages user adoption and report and data sharing.
Why Should I Care About Smart Visualization and Advanced DataDiscovery? Are you up on the latest analytics lingo or do you still think smart visualization is some kind of artificial eyeball? The Smarten approach to dataanalytics will get you there.
Why Should I Care About Smart Visualization and Advanced DataDiscovery? Are you up on the latest analytics lingo or do you still think smart visualization is some kind of artificial eyeball? The Smarten approach to dataanalytics will get you there.
Why Should I Care About Smart Visualization and Advanced DataDiscovery? Are you up on the latest analytics lingo or do you still think smart visualization is some kind of artificial eyeball? The Smarten approach to dataanalytics will get you there.
When it comes to business applications, these users will bring their experience as consumers into the workplace and demand ease-of-use, intuitive analytical tools and smart datavisualization tools that make their analysis clear and concise.
When it comes to business applications, these users will bring their experience as consumers into the workplace and demand ease-of-use, intuitive analytical tools and smart datavisualization tools that make their analysis clear and concise.
When it comes to business applications, these users will bring their experience as consumers into the workplace and demand ease-of-use, intuitive analytical tools and smart datavisualization tools that make their analysis clear and concise.
We had a great response, especially with our Advanced DataDiscovery with self serve data prep, smart visualization and plug n’ play predictive analytics. The ElegantJ BI booth was REALLY BUSY. We greeted customers, stakeholders, and partners and provided an update on business.
We had a great response, especially with our Advanced DataDiscovery with self serve data prep, smart visualization and plug n’ play predictive analytics. The ElegantJ BI booth was REALLY BUSY. We greeted customers, stakeholders, and partners and provided an update on business.
Kurt Schlegel discussed the next big disruption, ‘Self Serve Data Prep from Shadow IT to Citizen Data Science’ Rick Greenwald’s session was concise and to the point, ‘Spark: The Future of DataAnalytics’ Unfortunately, Gartner Analyst, Rita Sallam , wasn’t able to attend, but I am anxious to attend her session in 2017!
Whether you seek to boost your career, future-proof your skills, or tap into growing demand for dataanalytics, here are 5 reasons why Power BI might be your best move yet. Here’s a brief comparison: Tableau: For datavisualization specialists, Tableau is more preferred.
A BI dashboard — or business intelligence dashboard — is an information management tool that uses datavisualization to display KPIs (key performance indicators) tracked by a business to assess various aspects of performance. They aim at simplifying huge amounts of data, into simpler insights that can been easily understood and used.
Choosing and implementing a solution for advanced analytics and augmented datadiscovery is not as simple as buying team t-shirts for your company baseball team. Requirements Planning for DataAnalytics Many organizations are so anxious to get into analytics that they fail to consider the depth and breadth of their needs.
Choosing and implementing a solution for advanced analytics and augmented datadiscovery is not as simple as buying team t-shirts for your company baseball team. Requirements Planning for DataAnalytics Many organizations are so anxious to get into analytics that they fail to consider the depth and breadth of their needs.
Choosing and implementing a solution for advanced analytics and augmented datadiscovery is not as simple as buying team t-shirts for your company baseball team. Requirements Planning for DataAnalytics. DataAnalytics Literacy MUST Exist at All Organizational Levels. Don’t make assumptions.
The DataAnalytics Lifecycle is a diagram that depicts these steps for professionals that are involved in dataanalytics projects. The phases of the DataAnalytics Lifecycle are organized in a circular framework, which is referred to as the DataAnalytics Lifecycle. Click below to know more.
A BI dashboard — or business intelligence dashboard — is an information management tool that uses datavisualization to display KPIs (key performance indicators) tracked by a business to assess various aspects of performance. They aim at simplifying huge amounts of data, into simpler insights that can been easily understood and used.
What Is DataAnalytics? Dataanalytics is the science of analyzing raw data to draw conclusions about it. The process involves examining extensive data sets to uncover hidden patterns, correlations, and other insights. Data Mining : Sifting through data to find relevant information.
But, before we do that, you can check out our B usiness Analytics Certification Training that we offer to enhance your knowledge and gain a better understanding of what dataanalytics is all about and simultaneously gain a credential by IIBA. What is Business Analytics? Let’s head into the article!
AI can automate the tedious process of data cleaning, identifying outliers, and normalizing data. Data Analysis : AI powered tools can swiftly identify patterns, correlations, and trends, which would take humans much longer to analyze. Key Features: Conversational Analytics: Ask questions like, Why did profits drop in Q3?
Smarten is an amalgamation of dataanalytics engines and human interaction processes, like natural language, voice and text inputs which is expected to change the way you decide and act! So, this brings me back to the original question which made we wear the consultant’s hat. Is this Business Intelligence?
In our data-rich age, understanding how to analyze and extract true meaning from the digital insights available to our business is one of the primary drivers of success. Despite the colossal volume of data we create every day, a mere 0.5% is actually analyzed and used for datadiscovery , improvement, and intelligence.
A BI dashboard — or business intelligence dashboard — is an information management tool that uses datavisualization to display KPIs (key performance indicators) tracked by a business to assess various aspects of performance. They aim at simplifying huge amounts of data, into simpler insights that can been easily understood and used.
A BI dashboard — or business intelligence dashboard — is an information management tool that uses datavisualization to display KPIs (key performance indicators) tracked by a business to assess various aspects of performance. They aim at simplifying huge amounts of data, into simpler insights that can been easily understood and used.
Many of you must have an idea about Tableau being used for datavisualization and to infer insights. TABLEAU revolutionized Business Intelligence and paved the way for intuitive VisualDataAnalytics for everyone, regardless of their technical knowledge. But what is Business Intelligence and Analytics?
Discover how you can move beyond static, complex data into dynamic data that improves business performance and accelerates growth with Domo’s dataanalytics tools. Get insights more quickly with Domo’s automated datadiscovery tools powered by AI and machine learning.
Data Scientists Focus on Strategy, Citizen Data Scientists Deliver Daily! When Gartner talks about expanding dataanalytics to business users, they also talk about how the analytical tools must be suitable for business users.
Data Scientists Focus on Strategy, Citizen Data Scientists Deliver Daily! When Gartner talks about expanding dataanalytics to business users, they also talk about how the analytical tools must be suitable for business users.
And we are calling this technology Smarten Smarten is an amalgamation of dataanalytics engines and human interaction processes, like natural language, voice and text inputs which is expected to change the way you decide and act! So, this brings me back to the original question which made we wear the consultant’s hat.
And we are calling this technology Smarten Smarten is an amalgamation of dataanalytics engines and human interaction processes, like natural language, voice and text inputs which is expected to change the way you decide and act! So, this brings me back to the original question which made we wear the consultant’s hat.
This means that your business’s data is available and secure regardless of a data breach or system failure. For instance, when it comes to dataanalytics, ambitious companies across industries will look to a centralized solution that offers all of the insights, features, and functionality required for online BI in one place.
Business leaders, developers, data heads, and tech enthusiasts – it’s time to make some room on your business intelligence bookshelf because once again, datapine has new books for you to add. We have already given you our top datavisualization books , top business intelligence books , and best dataanalytics books.
It ensures that the data scientists can analyze the data sets beyond the hypothesis testing task and understand the data variables and the relationship among them. Exploratory Data Analysis with Techcanvass. Exploratory data analysis using Excel is the easiest way to start your dataanalytics journey.
To address these challenges, approximately 44% of companies are planning to invest in artificial intelligence (AI) to streamline their data warehousing processes and improve the accuracy of their insights. AI is a powerful tool that goes beyond traditional dataanalytics.
At present, 53% of businesses are in the process of adopting big dataanalytics as part of their core business strategy – and it’s no coincidence. To win on today’s information-rich digital battlefield, turning insight into action is a must, and online data analysis tools are the very vessel for doing so.
And just having lots of data isn’t enough – what’s important is to be able to focus on what’s important. New intelligent datadiscovery technologies, powered by machine learning, can help you get to the heart of the problem faster: what’s new and unusual? Good datavisualization is vital. Absolutely.
Data exploded and became big. Spreadsheets finally took a backseat to actionable and insightful datavisualizations and interactive business dashboards. The rise of self-service analytics democratized the data product chain. Suddenly advanced analytics wasn’t just for the analysts. Agile and flexible.
ElegantJ BI is pleased to be a Silver Sponsor at the Gartner Data & Analytics Summit, which will be held on June 6 and 7, 2017 in Mumbai, India. ” About ElegantJ BI.
Smart DataDiscovery Takes the Guesswork Out of Advanced Analytics! Augmented DataDiscovery tools offer guidance, auto-suggestions and recommendations to business users do not have to guess at what techniques to use for datavisualization, or predictive analytics.
Smart DataDiscovery Takes the Guesswork Out of Advanced Analytics! Augmented DataDiscovery tools offer guidance, auto-suggestions and recommendations to business users do not have to guess at what techniques to use for datavisualization, or predictive analytics.
Smart DataDiscovery Takes the Guesswork Out of Advanced Analytics! Augmented DataDiscovery tools offer guidance, auto-suggestions and recommendations to business users do not have to guess at what techniques to use for datavisualization, or predictive analytics.
We organize all of the trending information in your field so you don't have to. Join 57,000+ users and stay up to date on the latest articles your peers are reading.
You know about us, now we want to get to know you!
Let's personalize your content
Let's get even more personalized
We recognize your account from another site in our network, please click 'Send Email' below to continue with verifying your account and setting a password.


Let's personalize your content