This site uses cookies to improve your experience. To help us insure we adhere to various privacy regulations, please select your country/region of residence. If you do not select a country, we will assume you are from the United States. Select your Cookie Settings or view our Privacy Policy and Terms of Use.
Cookie Settings
Cookies and similar technologies are used on this website for proper function of the website, for tracking performance analytics and for marketing purposes. We and some of our third-party providers may use cookie data for various purposes. Please review the cookie settings below and choose your preference.
Used for the proper function of the website
Used for monitoring website traffic and interactions
Cookie Settings
Cookies and similar technologies are used on this website for proper function of the website, for tracking performance analytics and for marketing purposes. We and some of our third-party providers may use cookie data for various purposes. Please review the cookie settings below and choose your preference.
Strictly Necessary: Used for the proper function of the website
Performance/Analytics: Used for monitoring website traffic and interactions
Dataanalytics technology has become an integral part of organizational management. There are a lot of different ways that big data can help companies streamline certain processes and resolve various challenges that they face. The advent of datavisualization has made it easier than ever.
While different companies, regardless of their size, have different operational processes, they share a common need for actionable insight to drive success in their business. Advancement in big data technology has made the world of business even more competitive. This eliminates guesswork when coming up with business strategies.
One of the biggest advantages is that big data helps companies utilize businessintelligence. It is one of the biggest reasons that the market for big data is projected to be worth $273 billion by 2026. Companies are finding more creative ways to employ dataanalytics to improve their businessintelligence strategies.
Business reporting has been around for a long time but the tools and techniques of businessintelligence have refined over time and now with the recent popularity of data driven business approach, data has been identified as the most valuable asset of a business and dataanalytics and reporting has finally found a key place in the business world.
Since it is the prerogative of a consultant to question and modify predominant jargon, I am hatting (yes, this too is an English word) …I am hatting myself in the hat of a consultant this morning, and I am questioning the application of the term “ BusinessIntelligence.” Is this BusinessIntelligence?
Dataanalytics has accompanied me for 15 years already. I started my career as a data analyst in a controlling department immediately following my graduation from the University of West Bohemia; I now work as a data scientist providing consultancy services for a range of different fields.
Now, businesses, regardless of the industry, are leveraging data and BusinessIntelligence to stay ahead of the competition. BusinessIntelligence. In brief, businessintelligence is about how well you leverage, manage and analyze businessdata. Data mining. Conclusion.
These tools are meant only for programmers and data scientists. To empower business users and allow them to achieve goals and contribute to the bottom line, you provide advanced analytics and smart datavisualization tools in an easy-to-use environment that encourages user adoption and report and data sharing.
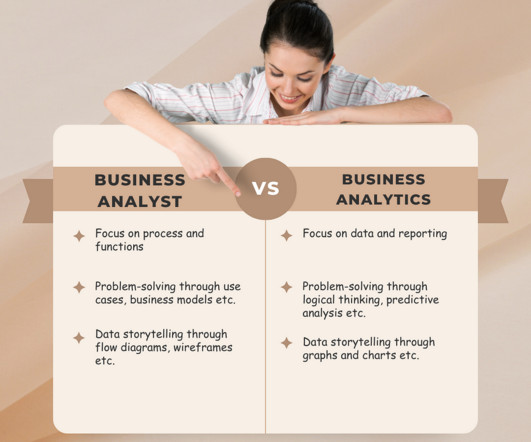
DataAnalytics and BusinessAnalytics: An Integrated Approach! What’s the difference between businessanalytics and dataanalytics? DataAnalytics is a process that is used as part of the BusinessAnalytics environment to monitor and manage the business.
DataAnalytics and BusinessAnalytics: An Integrated Approach! What’s the difference between businessanalytics and dataanalytics? DataAnalytics is a process that is used as part of the BusinessAnalytics environment to monitor and manage the business.
It can connect any data source, although the better your source, the better the results will be. Another key benefit is that it allows companies to create datavisualizations! Splunk is super secure as well, which is a huge concern for today’s businesses. Companies have a lot of options in 2021 for analytics tools.
Since it is the prerogative of a consultant to question and modify predominant jargon, I am hatting (yes, this too is an English word) …I am hatting myself in the hat of a consultant this morning, and I am questioning the application of the term “ BusinessIntelligence.” Is this BusinessIntelligence?
Since it is the prerogative of a consultant to question and modify predominant jargon, I am hatting (yes, this too is an English word) …I am hatting myself in the hat of a consultant this morning, and I am questioning the application of the term “ BusinessIntelligence.” Is this BusinessIntelligence?
Previously, we discussed the top 19 big data books you need to read, followed by our rundown of the world’s top businessintelligence books as well as our list of the best SQL books for beginners and intermediates. Datavisualization, or ‘data viz’ as it’s commonly known, is the graphic presentation of data.
Citizen Data Scientists are Not Born, They are Created! Dataanalytics software used to be reserved for data scientists, analysts and IT staff but not today! DataAnalytics is not just for data scientists! Original Post: Self-Serve DataAnalytics Can Work for You!
There’s not much value in holding on to raw data without putting it to good use, yet as the cost of storage continues to decrease, organizations find it useful to collect raw data for additional processing. The raw data can be fed into a database or data warehouse. If it’s not done right away, then later.
With ‘big data’ transcending one of the biggest businessintelligence buzzwords of recent years to a living, breathing driver of sustainable success in a competitive digital age, it might be time to jump on the statistical bandwagon, so to speak. “Data is what you need to do analytics.
What I did was something undigestible to me as well — I completed online courses in Excel, SQL, Python, DataVisualization, Data Analysis process, etc. I also had 2–3 interviews for a data analyst role but was not able to clear it. BusinessIntelligence Analyst BI analyst is a different role from a BA role.
1) What Is BusinessIntelligence And Analytics? 4) How Do BI And BA Apply To Business? If someone puts you on the spot, could you tell him/her what the difference between businessintelligence and analytics is? Your Chance: Want to extract the maximum potential out of your data?
Digital data not only provides astute insights into critical elements of your business but if presented in an inspiring, digestible, and logical format, it can tell a tale that everyone within the organization can get behind. Datavisualization methods refer to the creation of graphical representations of information.
Spreadsheets no longer provide adequate solutions for a serious company looking to accurately analyze and utilize all the business information gathered. That’s where businessintelligence reporting comes into play – and, indeed, is proving pivotal in empowering organizations to collect data effectively and transform insight into action.
Introduction Power BI is the leading tool for dataanalytics that is in such an ever-evolving field; it has played out a whole level when talking about datavisualization and businessintelligence. The businessintelligence market will be estimated at $43.03 billion by 2028.
You Too Can Enjoy BusinessIntelligence and Analytics! Every business has its unique needs, competitive strategy and challenges. But, not every business understands these factors or has the ability to make fact-based decisions. DataAnalytics for business does not have to be difficult or overwhelming.
Graphs, charts with colors, lines and shapes can often tell a story and communicate issues, challenges and opportunities in a business environment. According to Forbes, Almost eighty-thousand scientific studies attest that visual images promote retention.
BusinessIntelligence and Augmented Analytics Go Hand in Hand! BusinessIntelligence is mandatory! Without intelligence you have no insight into your customer buying behavior, your competition or your organization. Original Post : Succeed with BI Tools and Augmented Analytics!
BusinessIntelligence and Augmented Analytics Go Hand in Hand! BusinessIntelligence is mandatory! Without intelligence you have no insight into your customer buying behavior, your competition or your organization. Original Post : Succeed with BI Tools and Augmented Analytics!
BusinessIntelligence and Augmented Analytics Go Hand in Hand! BusinessIntelligence is mandatory! Without intelligence you have no insight into your customer buying behavior, your competition or your organization. Original Post : Succeed with BI Tools and Augmented Analytics!
4) BusinessIntelligence Job Roles. Does data excite, inspire, or even amaze you? Do you find computer science and its applications within the business world more than interesting? If you answered yes to any of these questions, you may want to consider a career in businessintelligence (BI).In
You Too Can Enjoy BusinessIntelligence and Analytics! Every business has its unique needs, competitive strategy and challenges. But, not every business understands these factors or has the ability to make fact-based decisions. DataAnalytics for business does not have to be difficult or overwhelming.
You Too Can Enjoy BusinessIntelligence and Analytics! Every business has its unique needs, competitive strategy and challenges. But, not every business understands these factors or has the ability to make fact-based decisions. DataAnalytics for business does not have to be difficult or overwhelming.
Your senior management team has decided to engender digital transformation and improve data literacy across the enterprise. The advantages of advanced analytics are numerous but a failure to launch, a failure to achieve user adoption will not help anyone!
Your senior management team has decided to engender digital transformation and improve data literacy across the enterprise. The advantages of advanced analytics are numerous but a failure to launch, a failure to achieve user adoption will not help anyone!
To make business decisions with spreadsheets, the finance team has to pore over thousands of rows of data. Analyzing company data lying in cumbersome spreadsheets becomes a chore so is often neglected.
BI dashboard is no longer the sole domain of a businessintelligence analyst or data scientist. When a business implements a mobile, self-serve BI tool, it ensures that its business users and team members will have access to critical analytical tools in the office and on the road.
BI dashboard is no longer the sole domain of a businessintelligence analyst or data scientist. When a business implements a mobile, self-serve BI tool, it ensures that its business users and team members will have access to critical analytical tools in the office and on the road.
BI dashboard is no longer the sole domain of a businessintelligence analyst or data scientist. When a business implements a mobile, self-serve BI tool, it ensures that its business users and team members will have access to critical analytical tools in the office and on the road.
Whether you seek to boost your career, future-proof your skills, or tap into growing demand for dataanalytics, here are 5 reasons why Power BI might be your best move yet. Here’s a brief comparison: Tableau: For datavisualization specialists, Tableau is more preferred. Power BI Desktop receives monthly updates.
A BI dashboard — or businessintelligence dashboard — is an information management tool that uses datavisualization to display KPIs (key performance indicators) tracked by a business to assess various aspects of performance. Comes in a desktop and a cloud version. They provide great dashboards and easy to use.
But, while data offers us invaluable insight in more ways than one, with so much to analyze and such little time, it’s becoming increasingly difficult to understand which metrics offer real value. As such, we have to find approaches to dataanalytics and businessintelligence. Now it’s time to dig a little deeper.
By acquiring a deep working understanding of data science and its many businessintelligence branches, you stand to gain an all-important competitive edge that will help to position your business as a leader in its field. Hands down one of the best books for data science. click for book source**.
A BI dashboard — or businessintelligence dashboard — is an information management tool that uses datavisualization to display KPIs (key performance indicators) tracked by a business to assess various aspects of performance. Comes in a desktop and a cloud version. They provide great dashboards and easy to use.
Dundas BI platform will be integrated with insightsoftware’s Logi solutions, strengthening self-service dataanalytics and visualization. August 11, 2022 – insightsoftware , a global provider of reporting, analytics, and performance management solutions, today announced it has acquired Dundas DataVisualization, Inc. ,
Are you up on the latest analytics lingo or do you still think smart visualization is some kind of artificial eyeball? Well, before you embarrass yourself at the next business conference, let’s get the facts! The Smarten approach to dataanalytics will get you there.
A recent Gartner report states that, natural language processing and conversational analytics will boost analytics and businessintelligence adoption from 35% of employees to over 50%, including new classes of users, particularly front-office workers.
We organize all of the trending information in your field so you don't have to. Join 57,000+ users and stay up to date on the latest articles your peers are reading.
You know about us, now we want to get to know you!
Let's personalize your content
Let's get even more personalized
We recognize your account from another site in our network, please click 'Send Email' below to continue with verifying your account and setting a password.


Let's personalize your content