This site uses cookies to improve your experience. To help us insure we adhere to various privacy regulations, please select your country/region of residence. If you do not select a country, we will assume you are from the United States. Select your Cookie Settings or view our Privacy Policy and Terms of Use.
Cookie Settings
Cookies and similar technologies are used on this website for proper function of the website, for tracking performance analytics and for marketing purposes. We and some of our third-party providers may use cookie data for various purposes. Please review the cookie settings below and choose your preference.
Used for the proper function of the website
Used for monitoring website traffic and interactions
Cookie Settings
Cookies and similar technologies are used on this website for proper function of the website, for tracking performance analytics and for marketing purposes. We and some of our third-party providers may use cookie data for various purposes. Please review the cookie settings below and choose your preference.
Strictly Necessary: Used for the proper function of the website
Performance/Analytics: Used for monitoring website traffic and interactions
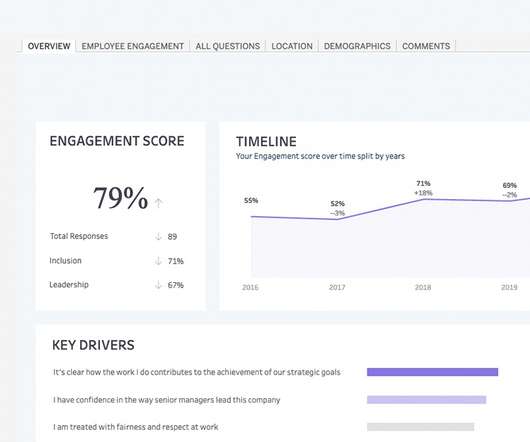
In today’s digital world, data drives everything across our personal and professional lives—from fitness plans to strategic business decisions. As a result, analytics dashboards and visualizations are beginning to appear everywhere: in consumer apps, business software, news sites, and more. 1 Henschen, Doug.
In today’s digital world, data drives everything across our personal and professional lives—from fitness plans to strategic business decisions. As a result, analytics dashboards and visualizations are beginning to appear everywhere: in consumer apps, business software, news sites, and more. 1 Henschen, Doug.
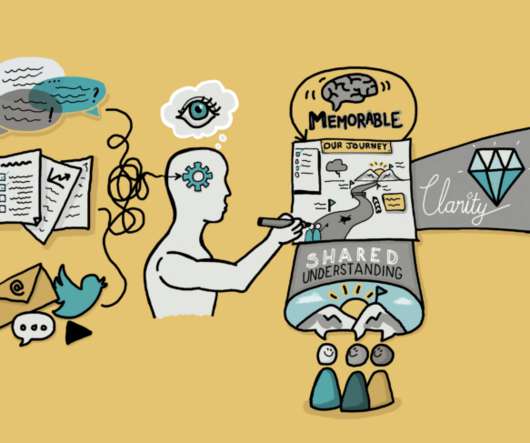
Grant Wright facilitated a half day workshop at the European Business Analysis conference 2020 on Unleashing the power of visual thinking. Grant actively practices Visual Thinking throughout his work and is passionate about its ability to create alignment, improve understanding and generate creative ideas.
In 2020, I am updating this definition to “A catalyst of problem-solving and effective decision making; facilitating problem-solving and decision making on desired strategic, operations, customerexperience, and systematic changes and aspects of how organizations serve their customers and operate at all levels.”.
Why is it still important for innovative businesses? Organizations want to optimize their end-to-end customerexperience, to improve productivity, and to engage the workforce in new ways. Visualization of data analyses can make or break how the analyses are understood. Good data visualization is vital.
We organize all of the trending information in your field so you don't have to. Join 57,000+ users and stay up to date on the latest articles your peers are reading.
You know about us, now we want to get to know you!
Let's personalize your content
Let's get even more personalized
We recognize your account from another site in our network, please click 'Send Email' below to continue with verifying your account and setting a password.


Let's personalize your content