This site uses cookies to improve your experience. To help us insure we adhere to various privacy regulations, please select your country/region of residence. If you do not select a country, we will assume you are from the United States. Select your Cookie Settings or view our Privacy Policy and Terms of Use.
Cookie Settings
Cookies and similar technologies are used on this website for proper function of the website, for tracking performance analytics and for marketing purposes. We and some of our third-party providers may use cookie data for various purposes. Please review the cookie settings below and choose your preference.
Used for the proper function of the website
Used for monitoring website traffic and interactions
Cookie Settings
Cookies and similar technologies are used on this website for proper function of the website, for tracking performance analytics and for marketing purposes. We and some of our third-party providers may use cookie data for various purposes. Please review the cookie settings below and choose your preference.
Strictly Necessary: Used for the proper function of the website
Performance/Analytics: Used for monitoring website traffic and interactions
Harness the power of Big Data to transform businessanalysis, make smarter decisions, and gain a competitive edge. Photo by Lukas Blazek on Unsplash Integrating Big Data into businessanalysis is a game changer in todays fast-paced business world.
Effective DataVisualization Techniques In todays data-driven world, the ability to present data clearly and effectively is essential. Datavisualization transforms complex data into visual formats like charts, graphs, and dashboards, making it easier to analyze, interpret, and communicate insights.
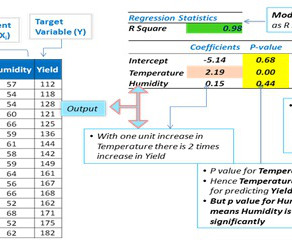
To better understand multiple linear regression, let’s look at one such analysis of independent variables: Temperature and Humidity, and a target variable (yield). How Can Multiple Linear Regression Be Helpful for BusinessAnalysis?
To better understand multiple linear regression, let’s look at one such analysis of independent variables: Temperature and Humidity, and a target variable (yield). How Can Multiple Linear Regression Be Helpful for BusinessAnalysis?
To better understand multiple linear regression, let’s look at one such analysis of independent variables: Temperature and Humidity, and a target variable (yield). How Can Multiple Linear Regression Be Helpful for BusinessAnalysis? Use Case – 1.
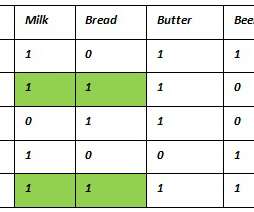
How Does Frequent Pattern Mining Support BusinessAnalysis? This method of analysis can be useful in evaluating data for various business functions and industries. Basket DataAnalysis – To analyze the association of purchased items in a single basket or single purchase.
How Does Frequent Pattern Mining Support BusinessAnalysis? This method of analysis can be useful in evaluating data for various business functions and industries. Basket DataAnalysis – To analyze the association of purchased items in a single basket or single purchase.
How Does Frequent Pattern Mining Support BusinessAnalysis? This method of analysis can be useful in evaluating data for various business functions and industries. Basket DataAnalysis – To analyze the association of purchased items in a single basket or single purchase.
How is the Paired Sample T Test Beneficial to BusinessAnalysis? This type of analysis can be useful in numerous situations. Let’s look at two use cases to better understand the benefit of this technique in businessanalysis. Therefore, the treatment was not effective.
How is the Paired Sample T Test Beneficial to BusinessAnalysis? This type of analysis can be useful in numerous situations. Let’s look at two use cases to better understand the benefit of this technique in businessanalysis. Therefore, the treatment was not effective.
How is the Paired Sample T Test Beneficial to BusinessAnalysis? This type of analysis can be useful in numerous situations. Let’s look at two use cases to better understand the benefit of this technique in businessanalysis. Therefore, the treatment was not effective. Use Case – 1.
How is Spearman’s Rank Correlation Useful for BusinessAnalysis? Use Case – 1 Business Problem: An educational organization wants to assess students’ rating, based on two different sources of observation. Original Post: What is Spearman’s Rank Correlation and How is it Useful for BusinessAnalysis?
How is Spearman’s Rank Correlation Useful for BusinessAnalysis? Use Case – 1 Business Problem: An educational organization wants to assess students’ rating, based on two different sources of observation. Original Post: What is Spearman’s Rank Correlation and How is it Useful for BusinessAnalysis?
How is Spearman’s Rank Correlation Useful for BusinessAnalysis? Business Problem: An educational organization wants to assess students’ rating, based on two different sources of observation. Original Post: What is Spearman’s Rank Correlation and How is it Useful for BusinessAnalysis? Use Case – 1.
Business Analysts play an important role in IT projects. But why Datavisualization? In this article, I am going to examine Why do Business Analysts need to learn Datavisualization skills? To be able to work on Data science/Analytics solutions, you need to upskill yourself with requisite skills.
Datavisualization is an essential step in the analytics life cycle. Before we dive into the topic, let us check the sales and profit data in different regions for various products. When we look at visuals, it holds our attention longer, and we process much more information than raw text. About Techcanvass.
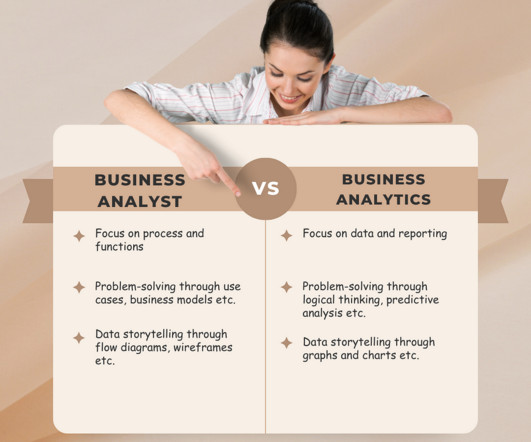
Gather and document business requirements Communicate between stakeholders and data teams Define key performance indicators (KPIs) and success metrics Interpret and translate data insights into business recommendations Assist in datavisualization and storytelling Ensure that data science models align with business objectives 2.
Tech: integrated knowledge bases, machine learning tips, and a guide to git for a business analyst. As we step into 2024, the pathway to becoming a data analyst encompasses a blend of education, skill development, and understanding of emerging trends in data analytics. > Enjoy the reading!
The benefits of Advanced Analytics include data sharing and allow the organization to produce fast, dependable insights and improve the value of businessanalysis across the enterprise. Empower users with augmented analytics that include ETL for business users, smart datavisualization and more!
The benefits of Advanced Analytics include data sharing and allow the organization to produce fast, dependable insights and improve the value of businessanalysis across the enterprise. Empower users with augmented analytics that include ETL for business users, smart datavisualization and more!
The benefits of Advanced Analytics include data sharing and allow the organization to produce fast, dependable insights and improve the value of businessanalysis across the enterprise. Empower users with augmented analytics that include ETL for business users, smart datavisualization and more!
So, The only difference is, data scientists perform it on a much larger scale, with complicated parameters, statistical parameters, and much more. exploratory dataanalysis example. Let us look at some basic but popular visualizations that help in exploratory dataanalysis.
The only difference is, data scientists perform it on a much larger scale, with complicated parameters, statistical parameters, and much more. exploratory dataanalysis example. Let us look at some basic but popular visualizations that help in exploratory dataanalysis.
This paper will help you understand the various elements which would help you in making the transition which has been outlined in the form of skills, qualifications, and the sequential steps necessary to acquire a position as a Business Analyst (BA) in the information technology area. Why Consider BusinessAnalysis in IT?
If your business has designated you a Citizen Data Scientist, you may feel intimidated and unprepared to take on the role. You are probably a business professional with a lot of knowledge in your chosen career and area of focus and none in the field of data science or businessanalysis.
If your business has designated you a Citizen Data Scientist, you may feel intimidated and unprepared to take on the role. You are probably a business professional with a lot of knowledge in your chosen career and area of focus and none in the field of data science or businessanalysis.
Analyze your data: Once ChatGPT is installed and integrated with Excel, you can use it to analyze your text data. This can involve analyzing sentiment, identifying keywords and themes, and extracting insights from the data. The post Revolutionize Your DataAnalysis and BusinessAnalysis with ChatGPT: Excel Integration and More!
What I did was something undigestible to me as well — I completed online courses in Excel, SQL, Python, DataVisualization, DataAnalysis process, etc. I also had 2–3 interviews for a data analyst role but was not able to clear it. I opted for Udemy courses and learnt Tableau and Power BI.
Understanding the type of data, the sources of this data, and the technology to be employed is crucial. Also, the skills required to manage and interpret the data effectively should not be underestimated. Here is a comprehensive guide on datavisualization that can serve as a resource for building foundational knowledge.
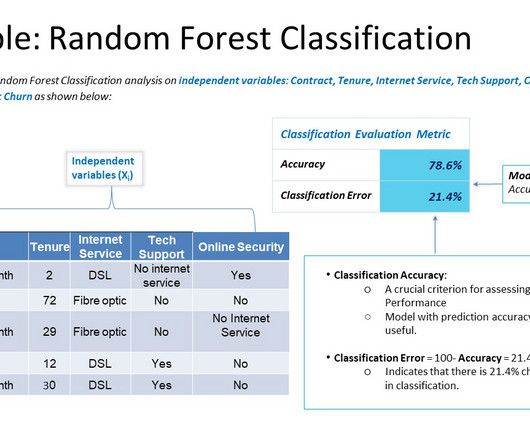
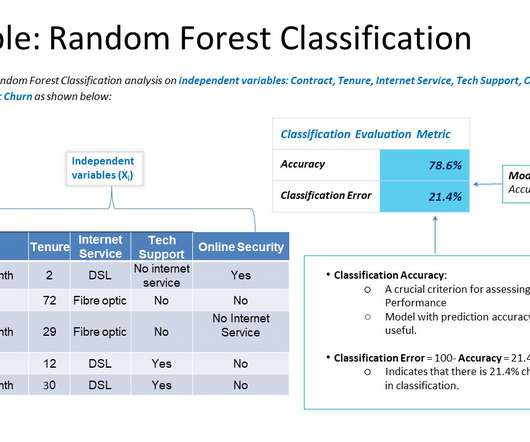
To further clarify the use of the Random Forest Classification model, let’s look at a sample customer churn analysis to predict the likelihood of customers to churn based upon important factors. How Can Random Forest Classification Be Helpful for BusinessAnalysis? Business Use Case 1 Business Problem: Predict loan default.
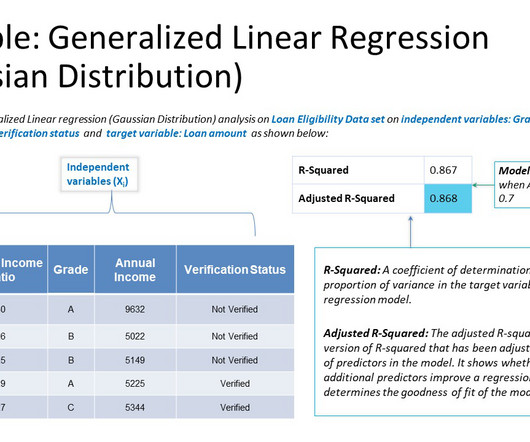
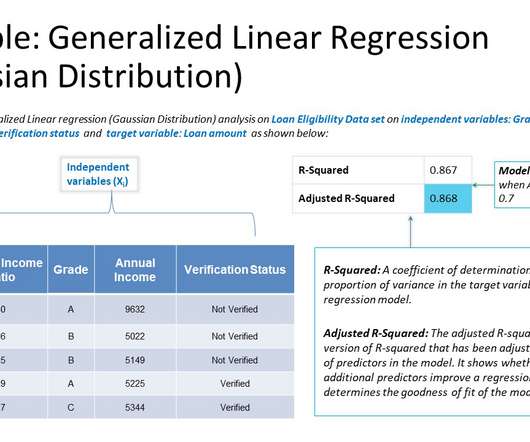
To have a better understanding of this algorithm, let’s look at one such analysis on loan eligibility to identify whether or not the amount is eligible for loan application based upon various influencing factors. H ow Can Generalized Linear Regression with Gaussian Distribution Be Helpful for BusinessAnalysis ?
To further clarify the use of the Random Forest Classification model, let’s look at a sample customer churn analysis to predict the likelihood of customers to churn based upon important factors. How Can Random Forest Classification Be Helpful for BusinessAnalysis? Business Use Case 1.
To have a better understanding of this algorithm, let’s look at one such analysis on loan eligibility to identify whether or not the amount is eligible for loan application based upon various influencing factors. H ow Can Generalized Linear Regression with Gaussian Distribution Be Helpful for BusinessAnalysis ?
To have a better understanding of this algorithm, let’s look at one such analysis on loan eligibility to identify whether or not the amount is eligible for loan application based upon various influencing factors. How Can Random Forest Classification Be Helpful for BusinessAnalysis? Business Use Case 1.
To further clarify the use of the Random Forest Classification model, let’s look at a sample customer churn analysis to predict the likelihood of customers to churn based upon important factors. How Can Random Forest Classification Be Helpful for BusinessAnalysis? Business Use Case 1.
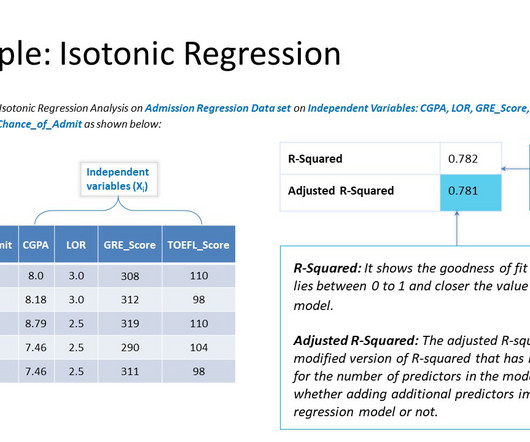
In order to get a comprehensive understanding of Isotonic Regression, let’s look at a sample analysis to determine a student’s chance of admission based upon various academic scores. How Can Isotonic Regression Be Helpful for BusinessAnalysis? If we consider the use cases below, we can see the value of Isotonic Regression.
In order to get a comprehensive understanding of Isotonic Regression, let’s look at a sample analysis to determine a student’s chance of admission based upon various academic scores. How Can Isotonic Regression Be Helpful for BusinessAnalysis? If we consider the use cases below, we can see the value of Isotonic Regression.
In order to get a comprehensive understanding of Isotonic Regression, let’s look at a sample analysis to determine a student’s chance of admission based upon various academic scores. How Can Isotonic Regression Be Helpful for BusinessAnalysis? If we consider the use cases below, we can see the value of Isotonic Regression.
DataVisualization: Master presenting complex data in easy-to-understand formats like charts and graphs using tools like Tableau or Power BI. The post Essential Technical Skills for Business Analysts in 2024 appeared first on BusinessAnalysis Blog.
If you look at the Histogram below, you will see that one value lies far to the left of all other data. This data point is an outlier. How Can Outlier Detection Improve BusinessAnalysis?
If you look at the Histogram below, you will see that one value lies far to the left of all other data. This data point is an outlier. How Can Outlier Detection Improve BusinessAnalysis?
If you look at the Histogram below, you will see that one value lies far to the left of all other data. This data point is an outlier. How Can Outlier Detection Improve BusinessAnalysis?
We organize all of the trending information in your field so you don't have to. Join 57,000+ users and stay up to date on the latest articles your peers are reading.
You know about us, now we want to get to know you!
Let's personalize your content
Let's get even more personalized
We recognize your account from another site in our network, please click 'Send Email' below to continue with verifying your account and setting a password.


Let's personalize your content