This site uses cookies to improve your experience. To help us insure we adhere to various privacy regulations, please select your country/region of residence. If you do not select a country, we will assume you are from the United States. Select your Cookie Settings or view our Privacy Policy and Terms of Use.
Cookie Settings
Cookies and similar technologies are used on this website for proper function of the website, for tracking performance analytics and for marketing purposes. We and some of our third-party providers may use cookie data for various purposes. Please review the cookie settings below and choose your preference.
Used for the proper function of the website
Used for monitoring website traffic and interactions
Cookie Settings
Cookies and similar technologies are used on this website for proper function of the website, for tracking performance analytics and for marketing purposes. We and some of our third-party providers may use cookie data for various purposes. Please review the cookie settings below and choose your preference.
Strictly Necessary: Used for the proper function of the website
Performance/Analytics: Used for monitoring website traffic and interactions
Without proper Dynamics 365 integration, data remains siloed, and decision-making becomes guesswork. But when BI dashboards are seamlessly linked, organizations can: Monitor business health in real-time : When BI dashboards are fully integrated, businesses can move beyond relying on outdated, end-of-month reports.
Armed with powerful data visualizations, managers and team members use these reports to track progress and performance against their business goals. For example, managers use them as a tool to monitor the status of a project or the performance of employees. There are several business scenarios in which monthly reports are useful.
As a result, finance pros can spend less time struggling with reporting at the right level and more time with the books. The solution offers a single source of real-timedata, providing a true feeling of confidence in financial reporting. It breaks down into the Investment by Feature and Spend reports.
Hevo Data is one such tool that helps organizations build data pipelines. This is why in this blog post, we list down the best Hevo Data alternatives for data integration. Wide Source Integration: The platform supports connections to over 150 data sources.
Traditional methods of analyzing structured data are not designed to efficiently process these large amounts of real-timedata that is collected from IoT devices. This is where AI-based analysis and response play a critical role in extracting optimal value from the data. and constantly report this data to backend.
Lack of predictability – with disjointed teams working without effective alignment and significant gaps in the data needed to guide them, releases become more complex and unwieldy, and KPIs are routinely compromised in favor of checking off completed tasks. What Features Make Jira Align Perfect for LPM?
Sisense News is your home for corporate announcements, new Sisense features, product innovation, and everything we roll out to empower our users to get the most out of their data. Every company is becoming a data company; there’s no getting around it. so why should you limit your data-driven decisions to those hours?
A strategic dashboard is a reporting tool for monitoring the long-term company strategy with the help of critical success factors. Exclusive Bonus Content: Download Data Implementation Tips! An operational dashboard is one of the types of dashboards used for monitoring and managing operations that have a shorter time horizon.
ZIF Dx+ (Zero Incident Framework Digital Xperience) addresses this need by offering an advanced solution for monitoring and optimizing digital experiences within Digital Experience Analytics. ZIF Dx+ empowers companies with real-time insights, automates problem resolution, and boosts overall productivity.
Users have commended Coupas ease of use and reporting features, as end users can customize and schedule reports with real-timedata access. On the other hand, users have highlighted how even long-time clients have to pay a hefty price to be recertified every two years.
For reference, here are the 4 primary types of dashboards for each main branch business-based activity: Strategic: A dashboard focused on monitoring long-term company strategies by analyzing and benchmarking a wide range of critical trend-based information. Don’t go over the top with real-timedata.
Let’s find out in this blog. Airbyte is an open-source data integration platform that allows organizations to easily replicate data from multiple sources into a central repository. Generative AI Support: Airbyte provides access to LLM frameworks and supports vector data to power generative AI applications.
Learn all about data dashboards with our executive bite-sized summary! What Is A Data Dashboard? When presenting data and communicating insights, it is important to create a dialogue – no one likes being preached throughout a whole presentation. They Allow For Real-TimeMonitoring. click to enlarge**.
Armed with powerful visualizations and real-timedata, modern weekly summary reports enable businesses to closely monitor their performance and the progress of their strategies to extract relevant insights and optimize their processes to ensure constant growth. Let’s look at it more in detail. click to enlarge**.
Management reporting is a source of business intelligence that helps business leaders make more accurate, data-driven decisions. In this blog post, we’re going to give a bit of background and context about management reports, and then we’re going to outline 10 essential best practices you can use to make sure your reports are effective.
To serve up quality realtimedata, realtime business analytics platforms leverage smart data storage solutions that empower users to gain access to up-to-the-minute insights in one centralized location and act accordingly. a) IT project management dashboard. click to enlarge**.
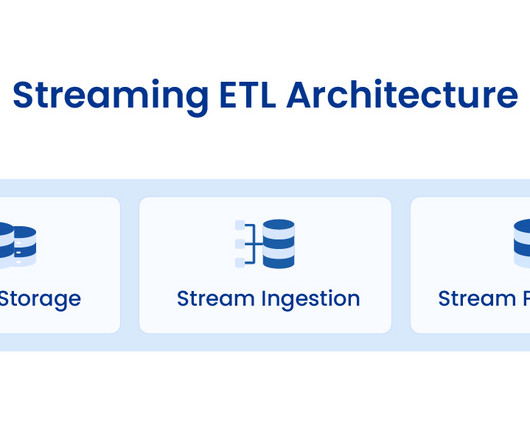
Streaming ETL is a modern approach to extracting, transforming, and loading (ETL) that processes and moves data from source to destination in real-time. It relies on real-timedata pipelines that process events as they occur. Events refer to various individual pieces of information within the data stream.
The financial health, flow, and fluidity of your business will ultimately dictate its long-term success, which is why monitoring your money matters carefully, comprehensively, and accurately is absolutely essential. For optimizing reports and detail analysis, you can check our blog article about financial report examples.
According to Accenture, 89% of business innovators believe that that big data analytics will revolutionize business operations in the same way as the World Wide Web. Moreover, 57% of enterprise organizations currently employ a chief data officer, another study conducted by MicroStrategy. Progress monitoring. click to enlarge**.
To work effectively, big data requires a large amount of high-quality information sources. Where is all of that data going to come from? Transparency: With the ability to monitor the movements of goods and delivery operatives in real-time, you can improve internal as well as external efficiency.
When you need a quick way to monitor your company’s success in meeting objectives, sales provide one of the easiest metrics since it is a direct display of efficiency related to profits. By understanding the historic patterns and combining them with more real-timedata, you can make smarter decisions regarding your sales pipeline.
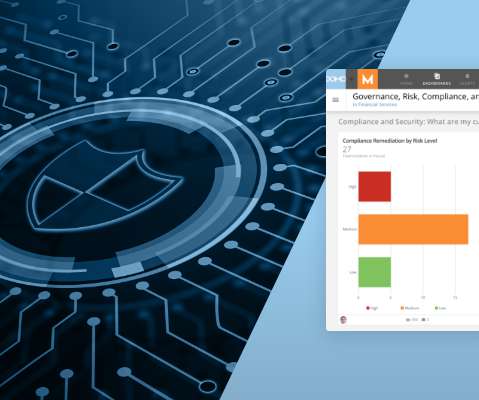
What’s more, often times there is also a disconnect between what a business considers security risks versus what security risks are actually present, creating an inaccurate picture of risk and its potential (or real) impact on the business. The post Why Measuring Cybersecurity Effectiveness Is a Must first appeared on Blog.
By working with a real-timedata platform like the Domo business cloud , sales organizations can get the information they need to confidently predict whether they will hit their targets. Here are three ways better data analytics can make your sales team more effective than ever before: 1. Click here to see a demo.
The benefits of AI-powered OKRs include improved strategic alignment, dynamic tracking, predictive success insights, and better decision-making based on real-timedata. Why is real-time tracking important for OKRs? What are the benefits of AI-powered OKRs? —
Data informing decisions As with many other industries, the transportation and logistics industry—particularly as it relates to the healthcare and retail sectors—has been profoundly affected by COVID-19, leaving many within the business either overworked or without any work at all. Visibility is the key,” Langmaid said.
We live in a world of data: There’s more of it than ever before, in a ceaselessly expanding array of forms and locations. Dealing with Data is your window into the ways data teams are tackling the challenges of this new world to help their companies and their customers thrive. billion market by 2025. Broader considerations.
These needs include data integration, automation, and real-timedata access. Breaking Down Data Silos Traditional software applications create data silos. A unified system allows organizations to have accessible data in one place, which makes data-driven decisions faster and more effective.
For front line teams, it’s often ignored in favour of preferred use of their own data from their own technology – which is isolated from the central BI architecture. Learn more about how Domo helps retail organisations and BI experts optimise with real-timedata, or check Domo out for yourself in our live demo series, the Daily Dose.
We live in a world of data: there’s more of it than ever before, in a ceaselessly expanding array of forms and locations. Dealing with Data is your window into the ways Data Teams are tackling the challenges of this new world to help their companies and their customers thrive. From ETL to ELT and beyond.
Splunk is proprietary software that provides a web-based interface for searching, monitoring, and evaluating machine-based big data. It performs different functions, such as collecting, indexing, and correlating real-timedata in a container that has searchable properties. Monitoring of business metrics.
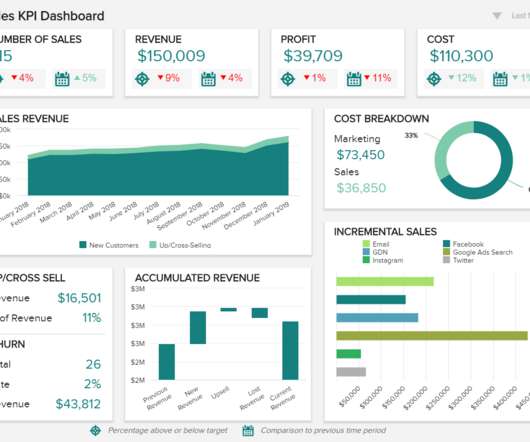
That’s why it’s critical to monitor and optimize relevant supply chain metrics. You can also offer special delivery services to decrease the delivery time and see how your customer satisfaction, in the long run, rises. Please, see the bottom of this article to take a closer look at a supply chain KPI dashboard.
As a complex situation evolved, we were able to build a dashboard that would allow us to monitor the overall health of our organization, and have the majority of this data coming to us in realtime.” The post A credit union’s journey to rapid business clarity first appeared on Blog.
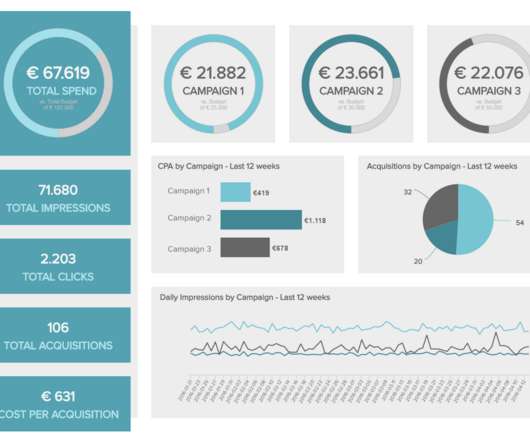
Now the agency automatically captures real-timedata for the earned, owned and paid campaigns of each client. Outcast was able to eliminate the manual reporting and completely recreate its reporting infrastructure with Domo’s out-of-the-box integrations and connectors.
Like pretty much everything else in the world, football has become more data-driven than ever, so when the 24 teams set out to win the championship on 11 June , you can bet your bottom Euro that each team’s tactics, formation, and training will be shaped by a mountain of data.
This integration allows seamless communication between departments and provides business leaders with the real-timedata they need when they need it. While this process may appear to be efficient, it lacks the ability to provide real-timedata and fails to tie financial data to inventory management.
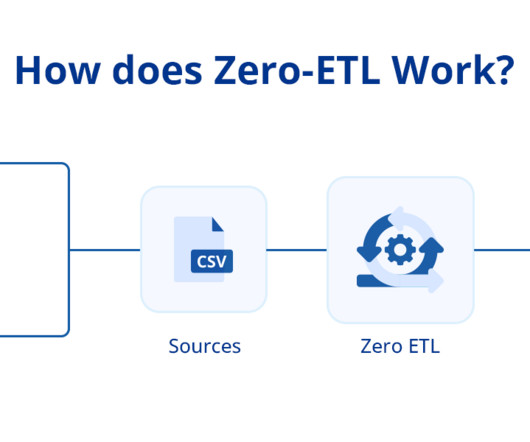
So, let’s explore them in detail: Zero ETL Components Real-TimeData Replication It is a fundamental component of zero-ETL. Organizations use real-timedata integration technologies to facilitate the continuous flow of data from source systems to destination repositories.
This is where the need to use a report tool and monitor when all of these little and big changes arise: knowing what is happening in your business is key to keep it afloat and be prepared to face any transformation or drastic shift. You won’t regret it!
To highlight the preventative purpose of reports in healthcare, 60% of healthcare leaders confirm their organization has adopted predictive analytics in recent times, and more will follow in the coming years. Disease monitoring. This is a testament to the essential role of predictive analytics in the sector.
Try our BI software 14-days for free & take advantage of your data! 8) “Performance Dashboards – Measuring, Monitoring, And Managing Your Business” by Wayne Eckerson. 10) “The Wall Street Journal Guide To Information Graphics: The Dos And Don’ts of Presenting Data, Facts, And Figures” by Dona M.
A call center dashboard is an intuitive visual reporting tool that displays a range of relevant call center metrics and KPIs that allow customer service managers and teams to monitor and optimize performance and spot emerging trends in a central location. The rate at which data is produced has now increased exponentially.
It allows you to systematically manage and monitor changes to assets, presenting a clear chronological display of version history. This is especially useful when many people work on the same files over time. 2: Asset versioning (Best for collaboration) Asset versioning in DAM is a fan-favorite feature among creative teams.
AI-driven document data extraction is at the forefront of this transformation, empowering organizations to harness the full potential of their data, streamline extraction processes, and make more informed decisions. Let’s jump right in!
a) Data Connectors Features. For a few years now, Business Intelligence (BI) has helped companies to collect, analyze, monitor, and present their data in an efficient way to extract actionable insights that will ensure sustainable growth. Table of Contents. 1) Benefits Of Business Intelligence Software. b) Analytics Features.
Typically, weekly sales reports templates can monitor the number of deals closed by the team or the revenue generated. Visualize and communicate your findings : the most important part, once you have analyzed and dug out insights from your data, is to convey this information to your audience. Don’t forget the executive summary.
We organize all of the trending information in your field so you don't have to. Join 57,000+ users and stay up to date on the latest articles your peers are reading.
You know about us, now we want to get to know you!
Let's personalize your content
Let's get even more personalized
We recognize your account from another site in our network, please click 'Send Email' below to continue with verifying your account and setting a password.


Let's personalize your content