

What is Tableau Public’s Viz of the Day?
Tableau
FEBRUARY 1, 2023
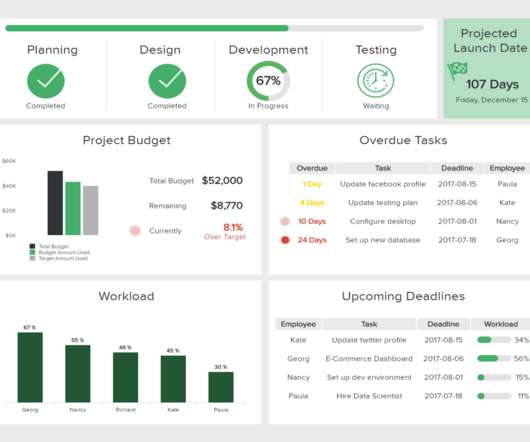
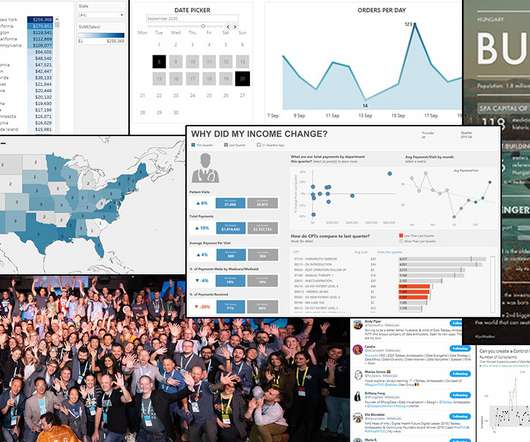
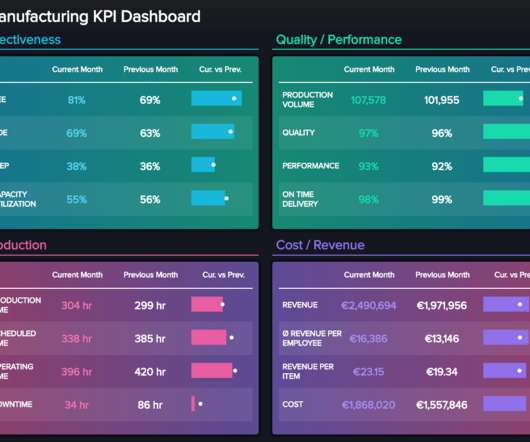
Sarah Molina Corporate Marketing Analyst Sarah Molina February 1, 2023 - 9:50pm February 4, 2023 Tableau Public is a free online visual analytics platform that allows you to learn and practice data skills, create and explore data visualizations, discover data stories, and create your own portfolio of work to share with your network.


Let's personalize your content