This site uses cookies to improve your experience. To help us insure we adhere to various privacy regulations, please select your country/region of residence. If you do not select a country, we will assume you are from the United States. Select your Cookie Settings or view our Privacy Policy and Terms of Use.
Cookie Settings
Cookies and similar technologies are used on this website for proper function of the website, for tracking performance analytics and for marketing purposes. We and some of our third-party providers may use cookie data for various purposes. Please review the cookie settings below and choose your preference.
Used for the proper function of the website
Used for monitoring website traffic and interactions
Cookie Settings
Cookies and similar technologies are used on this website for proper function of the website, for tracking performance analytics and for marketing purposes. We and some of our third-party providers may use cookie data for various purposes. Please review the cookie settings below and choose your preference.
Strictly Necessary: Used for the proper function of the website
Performance/Analytics: Used for monitoring website traffic and interactions
Can Smart DataVisualization Make My Business Smarter? All the data in the world can’t help you improve your business results unless you can sift through it and see it in a way that tells a story – a story that leads you to a conclusion, helps you solve a problem or allows you to see how your business can grow, change and succeed.
Can Smart DataVisualization Make My Business Smarter? All the data in the world can’t help you improve your business results unless you can sift through it and see it in a way that tells a story – a story that leads you to a conclusion, helps you solve a problem or allows you to see how your business can grow, change and succeed.
Machine Learning and Smart DataVisualization – The Perfect Combination! Data Analysis is one thing but visualizing the data in a meaningful way is a whole different story! So, let me tell you about smart datavisualization. Do you want to experience the benefits of Smart DataVisualization?
Machine Learning and Smart DataVisualization – The Perfect Combination! Data Analysis is one thing but visualizing the data in a meaningful way is a whole different story! So, let me tell you about smart datavisualization. Do you want to experience the benefits of Smart DataVisualization?
Table of Contents 1) The Benefits Of DataVisualization 2) Our Top 27 Best DataVisualizations 3) Interactive DataVisualization: What’s In It For Me? 4) Static vs. Animated DataVisualizationData is the new oil? No, data is the new soil.”
Editors note: This blog was originally published in October 2013, and has been completely revamped and updated for accuracy, relevancy, and comprehensiveness in September 2019 Prior to the 17th century, datavisualization existed mainly in the realm of maps, displaying land markers, cities, roads, and resources.
About Smarten The Smarten approach to augmented analytics and modern business intelligence focuses on the business user and provides tools for Advanced DataDiscovery so users can perform early prototyping and test hypotheses without the skills of a data scientist.
The Smarten approach to augmented analytics and modern business intelligence focuses on the business user and provides tools for Advanced DataDiscovery so users can perform early prototyping and test hypotheses without the skills of a data scientist.
The Smarten approach to augmented analytics and modern business intelligence focuses on the business user and provides tools for Advanced DataDiscovery so users can perform early prototyping and test hypotheses without the skills of a data scientist.
About Smarten The Smarten approach to augmented analytics and modern business intelligence focuses on the business user and provides tools for Advanced DataDiscovery so users can perform early prototyping and test hypotheses without the skills of a data scientist.
About Smarten The Smarten approach to augmented analytics and modern business intelligence focuses on the business user and provides tools for Advanced DataDiscovery so users can perform early prototyping and test hypotheses without the skills of a data scientist.
The Smarten approach to augmented analytics and modern business intelligence focuses on the business user and provides tools for Advanced DataDiscovery so users can perform early prototyping and test hypotheses without the skills of a data scientist.
The Smarten approach to augmented analytics and modern business intelligence focuses on the business user and provides tools for Advanced DataDiscovery so users can perform early prototyping and test hypotheses without the skills of a data scientist.
The Smarten approach to augmented analytics and modern business intelligence focuses on the business user and provides tools for Advanced DataDiscovery so users can perform early prototyping and test hypotheses without the skills of a data scientist.
The Smarten approach to augmented analytics and modern business intelligence focuses on the business user and provides tools for Advanced DataDiscovery so users can perform early prototyping and test hypotheses without the skills of a data scientist.
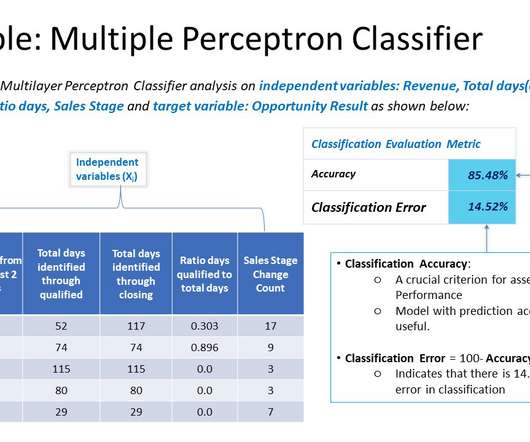
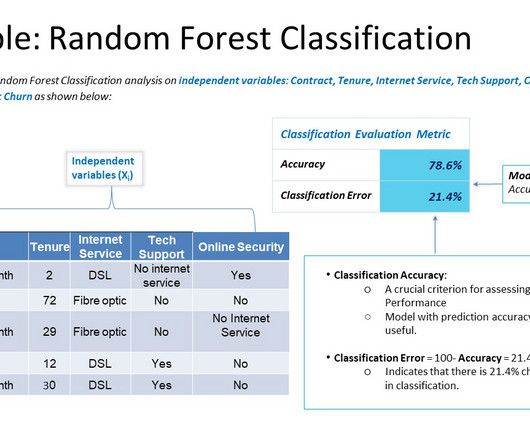
Assisted Predictive Modeling takes forecasting to the next level with auto-recommendations and suggestions so users can find the simplest way to analyze and get recommendations on which predictive algorithms will best suit the type and volume of the data they are analyzing.
Assisted Predictive Modeling takes forecasting to the next level with auto-recommendations and suggestions so users can find the simplest way to analyze and get recommendations on which predictive algorithms will best suit the type and volume of the data they are analyzing.
Assisted Predictive Modeling takes forecasting to the next level with auto-recommendations and suggestions so users can find the simplest way to analyze and get recommendations on which predictive algorithms will best suit the type and volume of the data they are analyzing.
About Smarten The Smarten approach to augmented analytics and modern business intelligence focuses on the business user and provides tools for Advanced DataDiscovery so users can perform early prototyping and test hypotheses without the skills of a data scientist.
About Smarten The Smarten approach to augmented analytics and modern business intelligence focuses on the business user and provides tools for Advanced DataDiscovery so users can perform early prototyping and test hypotheses without the skills of a data scientist.
The Smarten approach to augmented analytics and modern business intelligence focuses on the business user and provides tools for Advanced DataDiscovery so users can perform early prototyping and test hypotheses without the skills of a data scientist.
The Smarten approach to augmented analytics and modern business intelligence focuses on the business user and provides tools for Advanced DataDiscovery so users can perform early prototyping and test hypotheses without the skills of a data scientist.
A BI dashboard — or business intelligence dashboard — is an information management tool that uses datavisualization to display KPIs (key performance indicators) tracked by a business to assess various aspects of performance. They aim at simplifying huge amounts of data, into simpler insights that can been easily understood and used.
About Smarten The Smarten approach to augmented analytics and modern business intelligence focuses on the business user and provides tools for Advanced DataDiscovery so users can perform early prototyping and test hypotheses without the skills of a data scientist.
The Smarten approach to augmented analytics and modern business intelligence focuses on the business user and provides tools for Advanced DataDiscovery so users can perform early prototyping and test hypotheses without the skills of a data scientist.
Social BI Tools that allow for sharing of data, alerts, dashboards and interactivity to support decisions, enable online communication and collaboration. DataDiscovery including self-serve data preparation, smart datavisualization with charts, graphs and other visualizations for clarity and decisions.
Social BI Tools that allow for sharing of data, alerts, dashboards and interactivity to support decisions, enable online communication and collaboration. DataDiscovery including self-serve data preparation, smart datavisualization with charts, graphs and other visualizations for clarity and decisions.
Social BI Tools that allow for sharing of data, alerts, dashboards and interactivity to support decisions, enable online communication and collaboration. DataDiscovery including self-serve data preparation, smart datavisualization with charts, graphs and other visualizations for clarity and decisions.
About Smarten The Smarten approach to business intelligence and business analytics focuses on the business user and provides Advanced DataDiscovery so users can perform early prototyping and test hypotheses without the skills of a data scientist.
About Smarten The Smarten approach to business intelligence and business analytics focuses on the business user and provides Advanced DataDiscovery so users can perform early prototyping and test hypotheses without the skills of a data scientist.
The Smarten approach to business intelligence and business analytics focuses on the business user and provides Advanced DataDiscovery so users can perform early prototyping and test hypotheses without the skills of a data scientist.
About Smarten The Smarten approach to business intelligence and business analytics focuses on the business user and provides Advanced DataDiscovery so users can perform early prototyping and test hypotheses without the skills of a data scientist.
About Smarten The Smarten approach to business intelligence and business analytics focuses on the business user and provides Advanced DataDiscovery so users can perform early prototyping and test hypotheses without the skills of a data scientist.
The Smarten approach to business intelligence and business analytics focuses on the business user and provides Advanced DataDiscovery so users can perform early prototyping and test hypotheses without the skills of a data scientist.
A BI dashboard — or business intelligence dashboard — is an information management tool that uses datavisualization to display KPIs (key performance indicators) tracked by a business to assess various aspects of performance. They aim at simplifying huge amounts of data, into simpler insights that can been easily understood and used.
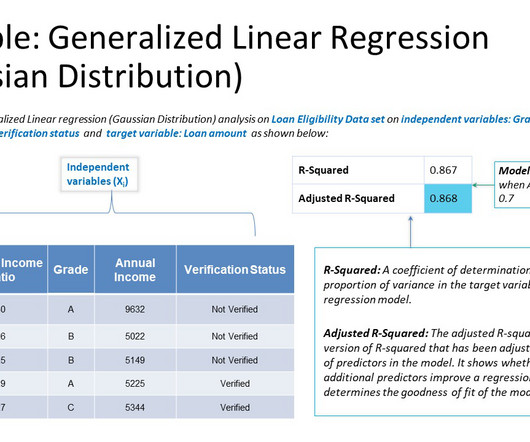
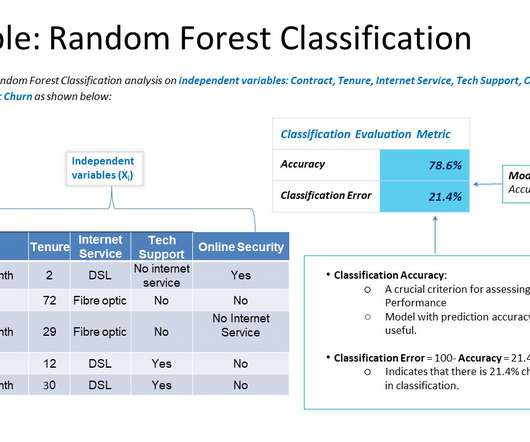
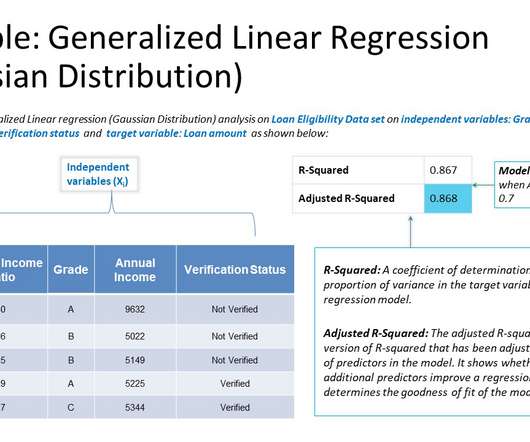
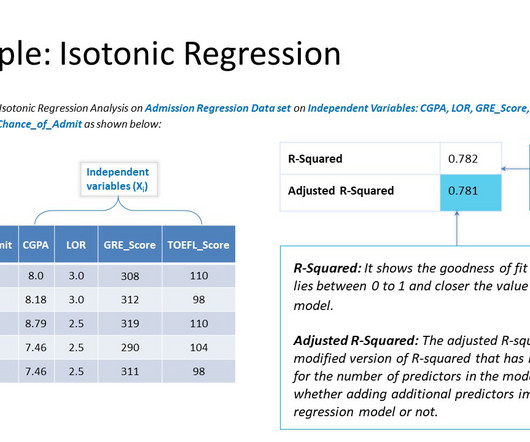
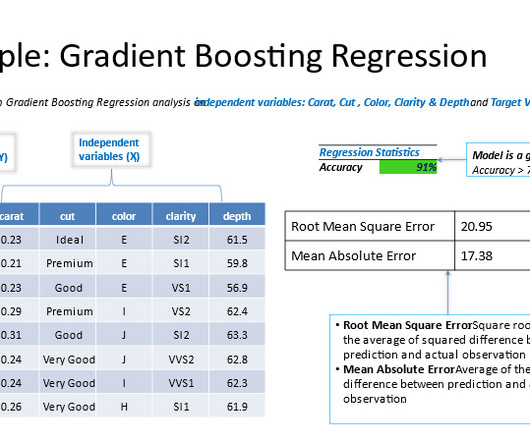
This article summarizes our recent article series on the definition, meaning and use of the various algorithms and analytical methods and techniques used in predictive analytics for business users, and in augmented data preparation and augmented datadiscovery tools.
This article summarizes our recent article series on the definition, meaning and use of the various algorithms and analytical methods and techniques used in predictive analytics for business users, and in augmented data preparation and augmented datadiscovery tools.
And in 2022, those awards came early and often for Domo, which won across three key categories: Business Intelligence, Embedded Business Intelligence, and DataDiscovery & Visualization. Q: Datadiscovery and visualization are more traditional, par-for-the-course ways that companies leverage data.
You can view business intelligence as an extremely powerful datadiscovery tool that is an extension of your fast thinking mind. They enable powerful datavisualization. To make the most out of it, there is an important dimension to disclose: datavisualization.
A BI dashboard — or business intelligence dashboard — is an information management tool that uses datavisualization to display KPIs (key performance indicators) tracked by a business to assess various aspects of performance. They aim at simplifying huge amounts of data, into simpler insights that can been easily understood and used.
A BI dashboard — or business intelligence dashboard — is an information management tool that uses datavisualization to display KPIs (key performance indicators) tracked by a business to assess various aspects of performance. They aim at simplifying huge amounts of data, into simpler insights that can been easily understood and used.
Management reporting is a source of business intelligence that helps business leaders make more accurate, data-driven decisions. In this blog post, we’re going to give a bit of background and context about management reports, and then we’re going to outline 10 essential best practices you can use to make sure your reports are effective.
In our data-rich age, understanding how to analyze and extract true meaning from the digital insights available to our business is one of the primary drivers of success. Despite the colossal volume of data we create every day, a mere 0.5% is actually analyzed and used for datadiscovery , improvement, and intelligence.
Many of you must have an idea about Tableau being used for datavisualization and to infer insights. TABLEAU revolutionized Business Intelligence and paved the way for intuitive VisualData Analytics for everyone, regardless of their technical knowledge. Visual analytics combines data analytics and datavisualization.
We organize all of the trending information in your field so you don't have to. Join 57,000+ users and stay up to date on the latest articles your peers are reading.
You know about us, now we want to get to know you!
Let's personalize your content
Let's get even more personalized
We recognize your account from another site in our network, please click 'Send Email' below to continue with verifying your account and setting a password.


Let's personalize your content