This site uses cookies to improve your experience. To help us insure we adhere to various privacy regulations, please select your country/region of residence. If you do not select a country, we will assume you are from the United States. Select your Cookie Settings or view our Privacy Policy and Terms of Use.
Cookie Settings
Cookies and similar technologies are used on this website for proper function of the website, for tracking performance analytics and for marketing purposes. We and some of our third-party providers may use cookie data for various purposes. Please review the cookie settings below and choose your preference.
Used for the proper function of the website
Used for monitoring website traffic and interactions
Cookie Settings
Cookies and similar technologies are used on this website for proper function of the website, for tracking performance analytics and for marketing purposes. We and some of our third-party providers may use cookie data for various purposes. Please review the cookie settings below and choose your preference.
Strictly Necessary: Used for the proper function of the website
Performance/Analytics: Used for monitoring website traffic and interactions
Bigdata can be a tool, a weapon or a currency. Now, amid the COVID-19 pandemic, bigdata has become a life-saving ally for the health care community. This moment in history is unlike any other — and the value of data in ending it resembles nothing we’ve yet seen. Here are a few ways this is possible: 1.
In 2013, Wired published a very interesting article about the role of bigdata in the field of integrated business systems. Author James Kobielus, the lead AI and data analyst for Wikibon and former IBM expert, said that there are a number of ways that integrated business systems are tapping the potential of AI and bigdata.
The proliferation of bigdata has had a huge impact on modern businesses. We have a post on some of the industries that have been most affected by bigdata. Of course, there are some reasons bigdata can help make our communities more sustainable. What Makes a Data Center Sustainable?
Data analytics has been the basis for the cryptocurrency market for years. In 2018, a study from the University of Bremen in Germany discussed some of the implications of bigdata for the altcoin industry. They found that predictive analytics algorithms were using social media data to forecast asset prices.
The market for data analytics in the insurance sector is projected to be worth nearly $22.5 Many of the applications of bigdata for insurance companies will be realized with machine learning technology. This definitely makes the insurance industry one of the biggest consumers of machine learning technology.
Enter data dashboards – one of history’s best innovations in business intelligence. To help you understand this notion in full, we’re going to explore a data dashboard definition, explain the power of dashboard data, and explore a selection of data dashboard examples. 5) Logistics Transportation Dashboard.
We will explain the ad hoc reporting meaning, benefits, uses in the real world, but first, let’s start with the ad hoc reporting definition. And this lies in the essence of the ad hoc reporting definition; providing quick reports for single-use, without generating complicated SQL queries. . What Is Ad Hoc Reporting?
With ‘bigdata’ transcending one of the biggest business intelligence buzzwords of recent years to a living, breathing driver of sustainable success in a competitive digital age, it might be time to jump on the statistical bandwagon, so to speak. “Data is what you need to do analytics. click for book source**.
If you are looking for data processing at a faster pace, then you should definitely be aware of this concept. Amazon Web Services Kinesis is a cloud-based service that is ideally scalable and managed for a large amount of real-timedata processing every second. Impeccable Features of AWS Kinesis. Conclusion.
Bigdata plays a crucial role in online data analysis , business information, and intelligent reporting. Companies must adjust to the ambiguity of data, and act accordingly. Another crucial factor to consider is the possibility to utilize real-timedata.
Over the past 5 years, bigdata and BI became more than just data science buzzwords. Without real-time insight into their data, businesses remain reactive, miss strategic growth opportunities, lose their competitive edge, fail to take advantage of cost savings options, don’t ensure customer satisfaction… the list goes on.
But before we get to our cloud computing challenges, let’s start with a simple explanation of the general characteristics and basic definitions. We mentioned the hot debate surrounding data protection in our definitive business intelligence trends guide. Exclusive Bonus Content: Download our free cloud computing tips!
Let’s kick things off by considering what a company dashboard is — or, in other words, provide an enterprise dashboard definition. An enterprise dashboard, created with modern business intelligence tools , is your torch in the dark — an effective means of making sense of your data and turning it into your company’s most powerful asset.
The benefits of a cloud data warehouse extend to breaking data silos , consolidating the data available in different applications, and identifying opportunities that would otherwise go unnoticed with a traditional on-premises data warehouse. Azure Synapse Analytics also integrates seamlessly with BI tools like Power BI.
This is why organizations have effective data management in place. But what exactly is data management? This article serves as a comprehensive guide to data management, covering its definition, importance, different processes, benefits, challenges, and best practices. What Is Data Management?
Moreover, we will offer dashboard storytelling tips and tricks that will help you make your data-driven narrative-building efforts as potent as possible, driving your business into exciting new dimensions. But let’s start with a simple definition. Bigdata commands big stories. What Is Dashboard Storytelling?
The saying “knowledge is power” has never been more relevant, thanks to the widespread commercial use of bigdata and data analytics. The rate at which data is generated has increased exponentially in recent years. Essential BigData And Data Analytics Insights. million searches per day and 1.2
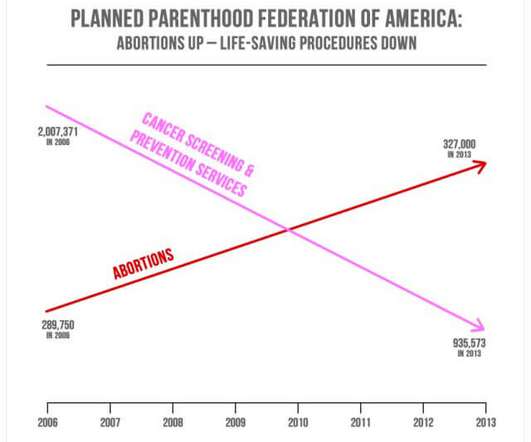
Essentially, the correlation and causation scenario is the assumption that because two variables changed at the same time, one caused the other. We are beginning to see correlating causation more and more with bigdata analyses. As seen in our example below, that shows a relation between a rise in ice cream sales and murders.
We organize all of the trending information in your field so you don't have to. Join 57,000+ users and stay up to date on the latest articles your peers are reading.
You know about us, now we want to get to know you!
Let's personalize your content
Let's get even more personalized
We recognize your account from another site in our network, please click 'Send Email' below to continue with verifying your account and setting a password.


Let's personalize your content