This site uses cookies to improve your experience. To help us insure we adhere to various privacy regulations, please select your country/region of residence. If you do not select a country, we will assume you are from the United States. Select your Cookie Settings or view our Privacy Policy and Terms of Use.
Cookie Settings
Cookies and similar technologies are used on this website for proper function of the website, for tracking performance analytics and for marketing purposes. We and some of our third-party providers may use cookie data for various purposes. Please review the cookie settings below and choose your preference.
Used for the proper function of the website
Used for monitoring website traffic and interactions
Cookie Settings
Cookies and similar technologies are used on this website for proper function of the website, for tracking performance analytics and for marketing purposes. We and some of our third-party providers may use cookie data for various purposes. Please review the cookie settings below and choose your preference.
Strictly Necessary: Used for the proper function of the website
Performance/Analytics: Used for monitoring website traffic and interactions
There are countless examples of bigdata transforming many different industries. It can be used for something as visual as reducing traffic jams, to personalizing products and services, to improving the experience in multiplayer video games. We would like to talk about datavisualization and its role in the bigdata movement.
However, computerization in the digital age creates massive volumes of data, which has resulted in the formation of several industries, all of which rely on data and its ever-increasing relevance. Data analytics and visualization help with many such use cases. It is the time of bigdata.
Bigdata is shaping our world in countless ways. Data powers everything we do. Exactly why, the systems have to ensure adequate, accurate and most importantly, consistent data flow between different systems. A point of data entry in a given pipeline. The destination is decided by the use case of the data pipeline.
The Bureau of Labor Statistics estimates that the number of data scientists will increase from 32,700 to 37,700 between 2019 and 2029. Unfortunately, despite the growing interest in bigdata careers, many people don’t know how to pursue them properly. Data Mining Techniques and DataVisualization.
Working with massive structured and unstructured data sets can turn out to be complicated. It’s obvious that you’ll want to use bigdata, but it’s not so obvious how you’re going to work with it. So, let’s have a close look at some of the best strategies to work with large data sets. It’s much easier to work with graphs.
Enterprises utilize data to optimize practically all business operations today. Traditional databases, on the other hand, do not meet the shifting demands of data analysis, which need access to bigdata for visualization and reporting. However, they do n. Read More.
The ETL process is defined as the movement of data from its source to destination storage (typically a DataWarehouse) for future use in reports and analyzes. The data is initially extracted from a vast array of sources before transforming and converting it to a specific format based on business requirements.
Automating your data processing routine can offer your business a lot of benefits. BI tools use the BigData approach and apply it to your company data. Dundas transforms loads of data into visually appealing and easily comprehensible reports that can be infinitely customized. Get Real-Time Analysis.
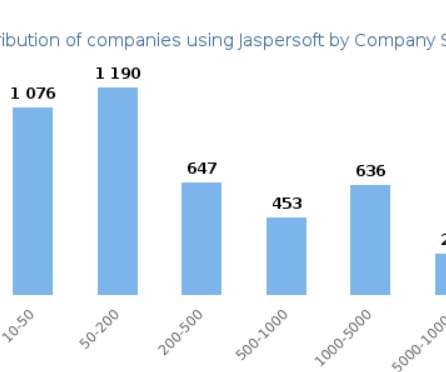
TIBCO Jaspersoft offers a complete BI suite that includes reporting, online analytical processing (OLAP), visual analytics , and data integration. The web-scale platform enables users to share interactive dashboards and data from a single page with individuals across the enterprise. Good Visualization Options.
To stay relevant in the market and to increase brand awareness, organizations use bigdata analytics and business intelligence to navigate their way after getting a full understanding of their ideal customers and their behavior before and during the buying journey. Data mining. Visual Analytics and DataVisualization.
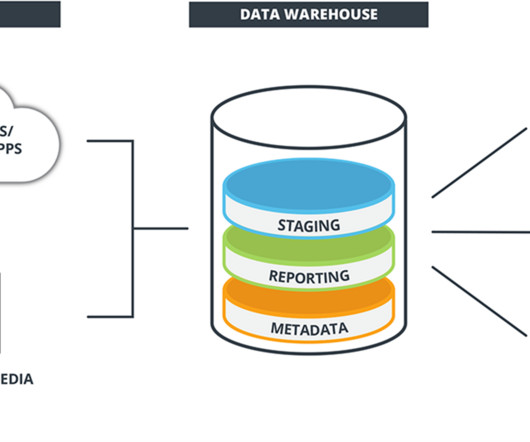
In the digital age, a datawarehouse plays a crucial role in businesses across several industries. It provides a systematic way to collect and analyze large amounts of data from multiple sources, such as marketing, sales, finance databases, and web analytics. What is a DataWarehouse?
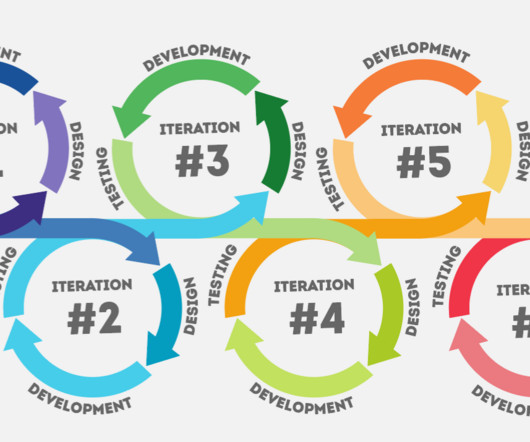
If you have had a discussion with a data engineer or architect on building an agile datawarehouse design or maintaining a datawarehouse architecture, you’d probably hear them say that it is a continuous process and doesn’t really have a definite end. What do you need to build an agile datawarehouse?
5 Advantages of Using a Redshift DataWarehouse. Whatever business you’re in, your company is becoming a data company. That means you need to put all that data somewhere. Chances are it’s in a datawarehouse, and even better money says it’s an AWS datawarehouse. D3 DataVisualization ?—
With ‘bigdata’ transcending one of the biggest business intelligence buzzwords of recent years to a living, breathing driver of sustainable success in a competitive digital age, it might be time to jump on the statistical bandwagon, so to speak. of all data is currently analyzed and used. click for book source**.
Since I couldn’t be in two places at the same time, I tried to make the choices that were most relevant to our team, our customers and our partners, and I chose the following sessions.
Since I couldn’t be in two places at the same time, I tried to make the choices that were most relevant to our team, our customers and our partners, and I chose the following sessions.
Do We Still Need a DataWarehouse – Roxanne Edijali. Navigating the Data Lake – Adam Ronthal. Interactive Visualizations for Everyone – Rita Sallam. BigData Discovery – Rita Sallam. Mobile BI – It’s Time to Innovate – Bhavish Sood.
In many of the conversations we have with IT and business leaders, there is a sense of frustration about the speed of time-to-value for bigdata and data science projects. We often hear that organizations have invested in data science capabilities but are struggling to operationalize their machine learning models.
The tech world has long talked about relational databases, but in a datawarehouse, relating data is tough because the data comes from so many sources. A half-mile per gallon increase, thanks to data. If you do not, you will always have incomplete data and therefore decisions based on incomplete information.
Attempting to learn more about the role of bigdata (here taken to datasets of high volume, velocity, and variety) within business intelligence today, can sometimes create more confusion than it alleviates, as vital terms are used interchangeably instead of distinctly. Bigdata challenges and solutions.
What is Hevo Data and its Key Features Hevo is a data pipeline platform that simplifies data movement and integration across multiple data sources and destinations and can automatically sync data from various sources, such as databases, cloud storage, SaaS applications, or data streaming services, into databases and datawarehouses.
Cloud data integration requires different tools and capabilities than integration for system applications. It is focused on accessibility of the data from any source, allowing business users to create visualizations—with the flexibility and the power of the cloud. Emphasize performance, cost reduction, and control. Conclusion.
In recent years, there has been a growing interest in NoSQL databases, which are designed to handle large volumes of unstructured or semi-structured data. These databases are often used in bigdata applications, where traditional relational databases may not be able to handle the scale and complexity of the data.
2007: Amazon launches SimpleDB, a non-relational (NoSQL) database that allows businesses to cheaply process vast amounts of data with minimal effort. An efficient bigdata management and storage solution that AWS quickly took advantage of. They now have a disruptive data management solution to offer to its client base.
They hold structured data from relational databases (rows and columns), semi-structured data ( CSV , logs, XML , JSON ), unstructured data (emails, documents, PDFs), and binary data (images, audio , video). Sisense provides instant access to your cloud datawarehouses. Connect tables.
“Without bigdata, you are blind and deaf and in the middle of a freeway.” – Geoffrey Moore, management consultant, and author. In a world dominated by data, it’s more important than ever for businesses to understand how to extract every drop of value from the raft of digital insights available at their fingertips.
Even as we grow in our ability to extract vital information from bigdata, the scientific community still faces roadblocks that pose major data mining challenges. In this article, we will discuss 10 key issues that we face in modern data mining and their possible solutions.
It was a big investment that is still viable, and one that forms the legacy databases of many companies today. . Fast forward to BigData. Now we can throw in the four 4 V’s of BigData (Variety, Volume, Velocity, and Veracity) and compound the data issues of the enterprise with an even bigger data issue.
The previous blogs in this series discussed the top 5 pitfalls of traditional datawarehouses and defined the Operational DataWarehouse (ODW ) as a potential solution. Many use more than 20 different visualization and query tools. Email me at Pradeep.bhanot@actian.com if you would like to share your views.
Here at Sisense, we think about this flow in five linear layers: Raw This is our data in its raw form within a datawarehouse. We follow an ELT ( E xtract, L oad, T ransform) practice, as opposed to ETL, in which we opt to transform the data in the warehouse in the stages that follow. Dig into AI.
Two orthogonal approaches to data analytics have developed in this decade of BI: 1. Operating “in-data” to enable the direct query of unstructured data lakes, providing a visualization layer on top of them. This is typically done on top of a high-performance database and, these days, on top of a cloud datawarehouse.
In Data-Powered Businesses , we dive into the ways that companies of all kinds are digitally transforming to make smarter data-driven decisions, monetize their data, and create companies that will thrive in our current era of BigData. Datasets are on the rise and most of that data is on the cloud.
Real time business intelligence is the use of analytics and other data processing tools to give companies access to the most recent, relevant data and visualizations. To provide real-time data, these platforms use smart data storage solutions such as Redshift datawarehouses , visualizations, and ad hoc analytics tools.
This is one of the reasons we’ve seen the rise of data teams — they’ve grown beyond Silicon Valley startups and are finding homes in Fortune 500 companies. As data has become more massive, the technical skills needed to wrangle it have also increased. Situation #2: Established company creates a data team for deeper insights.
The challenge with analyzing and visualizing social relationships is that the underlying data doesn’t match well with the relational data structures that most datawarehouses are designed around. Meaning difficult data problems can be analyzed more quickly, giving leaders the answers they seek fast.
Data space dimension: Traditional data vs. bigdata. This dimension focuses on what type of data the CDO has to wrangle. Traditional datasets are often relational data found at the core of transactional services and operations: Think of an accounting system or point-of-sale system that spans multiple locations.
The modern data stack (MDS) is a collection of tools for data integration that enable organizations to collect, process, store and analyze data. Being based on a well-integrated cloud platform, modern data stack offers scalability, efficiency, and proficiency in data handling.
Unlocking the Potential of Amazon Redshift Amazon Redshift is a powerful cloud-based datawarehouse that enables quick and efficient processing and analysis of bigdata. Amazon Redshift can handle large volumes of data without sacrificing performance or scalability. What Is Amazon Redshift?
Azure SQL DataWarehouse, now called Azure Synapse Analytics, is a powerful analytics and BI platform that enables organizations to process and analyze large volumes of data in a centralized place. However, this data is often scattered across different systems, making it difficult to consolidate and utilize effectively.
As quantitative data is always numeric, it’s relatively straightforward to put it in order, manage it, analyze it, visualize it, and do calculations with it. Spreadsheet software like Excel, Google Sheets, or traditional database management systems all mainly deal with quantitative data.
Read on to explore more about structured vs unstructured data, why the difference between structured and unstructured data matters, and how cloud datawarehouses deal with them both. Structured vs unstructured data. However, both types of data play an important role in data analysis.
In many of the conversations we have with IT and business leaders, there is a sense of frustration about the speed of time-to-value for bigdata and data science projects. We often hear that organizations have invested in data science capabilities but are struggling to operationalize their machine learning models.
Data science covers the complete data lifecycle: from collection and cleaning to analysis and visualization. Data scientists use various tools and methods, such as machine learning, predictive modeling, and deep learning, to reveal concealed patterns and make predictions based on data.
With Astera, users can: Extract data from PDFs using our LLM-powered solution. Cleanse and validate Integrate data from CRMs, databases, EDI files, and APIs. Load data to various cloud datawarehouses and lakes. Govern their data assets. AI-powered data mapping. Integration support for BigData.
We organize all of the trending information in your field so you don't have to. Join 57,000+ users and stay up to date on the latest articles your peers are reading.
You know about us, now we want to get to know you!
Let's personalize your content
Let's get even more personalized
We recognize your account from another site in our network, please click 'Send Email' below to continue with verifying your account and setting a password.


Let's personalize your content