This site uses cookies to improve your experience. To help us insure we adhere to various privacy regulations, please select your country/region of residence. If you do not select a country, we will assume you are from the United States. Select your Cookie Settings or view our Privacy Policy and Terms of Use.
Cookie Settings
Cookies and similar technologies are used on this website for proper function of the website, for tracking performance analytics and for marketing purposes. We and some of our third-party providers may use cookie data for various purposes. Please review the cookie settings below and choose your preference.
Used for the proper function of the website
Used for monitoring website traffic and interactions
Cookie Settings
Cookies and similar technologies are used on this website for proper function of the website, for tracking performance analytics and for marketing purposes. We and some of our third-party providers may use cookie data for various purposes. Please review the cookie settings below and choose your preference.
Strictly Necessary: Used for the proper function of the website
Performance/Analytics: Used for monitoring website traffic and interactions
There are a lot of ways that organizations can leverage bigdata. Most of them don’t have difficulty collecting the data they need to make more informed decisions. However, they often struggle to conceptualize the data and present it in a format that supports their conclusions. There are a lot of benefits of bigdata.
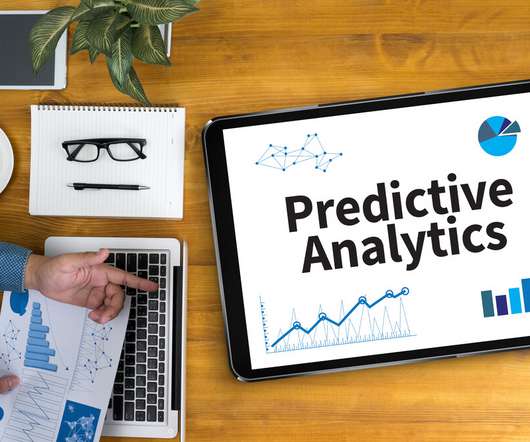
Predictive analytics, sometimes referred to as bigdata analytics, relies on aspects of data mining as well as algorithms to develop predictive models. These predictive models can be used by enterprise marketers to more effectively develop predictions of future user behaviors based on the sourced historical data.
These massive storage pools of data are among the most non-traditional methods of data storage around and they came about as companies raced to embrace the trend of BigData Analytics which was sweeping the world in the early 2010s. BigData is, well…big.
Studying historical data can help your company measure an employee onboarding process’s effectiveness. With the help of a benchmark, you can compare new hires’ engagement to the organization’s historical data. When an employee performs below expectation, you can take prompt action to improve their output.
Domo was also invited to be part of the future session panel, discussing ways executives can navigate the next decade as brand ambitions flourish alongside advances in bigdata, automation, real-time analytics, artificial intelligence and personalization.
With the increase in bigdata analysis and computational power available to us nowadays, the invention of LSTM has brought RNNs to the foreground. . It can learn about the filters and characteristics of the image, unlike the primitive data analytics model trained enough with these filters. . LSTM and Bidirectional LSTM.
Type of Data Mining Tool Pros Cons Best for Simple Tools (e.g., – Datavisualization and simple pattern recognition. Simplifying datavisualization and basic analysis. – May not cover all data mining needs. Streamlining industry-specific data processing. BigData Tools (e.g.,
When SaaS is combined with AI capabilities , it enables businesses to obtain better value from their data, automate and personalize services, improve security, and supplement human capacity. How will AI improve SaaS in 2020? This trend doesn’t apply to SaaS vendors alone.
The system associates data instead of joining tables. This capability is fundamental for modern analytics as it enables users to explore data quickly and in a way that suits their analytics style. It’s easy to navigate around the software and doesn’t take much training to get a person to create their own datavisualizations.
Having the right data mapping tool is crucial for efficient data integration. It simplifies and automates the process, reduces manual effort, and ensures accurate mapping between data sources. Its automation and orchestration features reduce the time needed to manage ETL processes by as much as 80%.
Data exploded and became big. Spreadsheets finally took a backseat to actionable and insightful datavisualizations and interactive business dashboards. The rise of self-service analytics democratized the data product chain. 2) Data Discovery/Visualization. We all gained access to the cloud.
By integrating Vizlib, businesses can truly maximize their Qlik investment, improving decision-making efficiency and gaining deeper insights from their data. The Growing Importance of DataVisualization In the era of bigdata, the ability to visualize information has become a cornerstone of effective business analytics.
We organize all of the trending information in your field so you don't have to. Join 57,000+ users and stay up to date on the latest articles your peers are reading.
You know about us, now we want to get to know you!
Let's personalize your content
Let's get even more personalized
We recognize your account from another site in our network, please click 'Send Email' below to continue with verifying your account and setting a password.


Let's personalize your content