This site uses cookies to improve your experience. To help us insure we adhere to various privacy regulations, please select your country/region of residence. If you do not select a country, we will assume you are from the United States. Select your Cookie Settings or view our Privacy Policy and Terms of Use.
Cookie Settings
Cookies and similar technologies are used on this website for proper function of the website, for tracking performance analytics and for marketing purposes. We and some of our third-party providers may use cookie data for various purposes. Please review the cookie settings below and choose your preference.
Used for the proper function of the website
Used for monitoring website traffic and interactions
Cookie Settings
Cookies and similar technologies are used on this website for proper function of the website, for tracking performance analytics and for marketing purposes. We and some of our third-party providers may use cookie data for various purposes. Please review the cookie settings below and choose your preference.
Strictly Necessary: Used for the proper function of the website
Performance/Analytics: Used for monitoring website traffic and interactions
Visual thinking and creativity Do you have genius-level creativity? How is it related to visual thinking? Another screaming piece of information – our creativity is directly affecting visual thinking while most people in the world better perceive information in visual format Do you see the problem here?
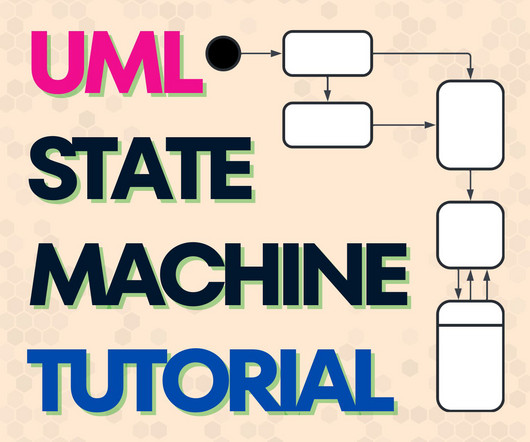
What is the UML State Diagram In software development, understanding how objects behave and change over time is essential to model system behavior. This is where the UML State Machine Diagram comes into play. Why Do We use UML State Machine Diagram for our projects? But why do we need them, and what makes them so valuable?
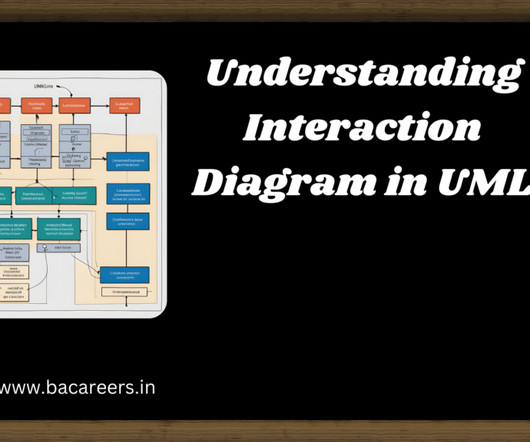
Interaction Diagram : Interaction diagrams are crucial tools in Unified Modeling Language (UML) that help visualize how objects in a system interact with each other. These diagrams are essential for designing and understanding complex systems, offering a clear view of the interactions between various components.
Unified Modeling Language (UML) stands as the cornerstone of modern software development, offering a standardized approach to modeling systems. Among its diverse set of diagrams, UML interaction diagrams hold a special place, facilitating the visualization and understanding of dynamic interactions within a system.
UMLs Sequence Diagram is the most common way to describe interactions across several services. PlantUML is a great format for visualizing such interactions. You can use different diagrams to describe a flow, such as a UML Activity or Flowchart. This is an example of why sometimes you might not proceed with an optimal solution.
And some people told me UML is dead — still kicking, and useful as ever! This is the first of a series of three articles where I intend to explore possible AI advancements in different tracks: > Keep reading… 2) How does the Artificial Intelligence revolution impact IT Business Analysts? What to do first? Who to talk to?
This article explores practices proposed by the International Institute of Business Analysis (IIBA®) that make Product Owners excel in their work. The BABoK and from the PMI Guide include several techniques through analysis and modeling (for example UML and BPMN diagrams ) that help with that.
In this article, we are going to discuss BPMN certification and its implementation while considering its methods, examples, elements, and all the other relevant information that you need to know. In comparison to UML Activity diagrams, it is more intelligible (at least to non-techies) and more suitable for process analysis and design.
link] In this article, I demonstrate how it is possible to use Chat GPT as an assistant (or helper) in executing business analysis tasks based on a case study that deals with developing an application by a startup. Check out this interesting interview and the behind-the-scenes of how it was carried out in the Interview with GPT Chat article.
Welcome to the Business Analysis Digest #37, with the best business analysis and related topics articles of August 2023. Business Analysis Articles 15 Tips for Outsourced Software Development Success by Karl Wiegers Image by wirestock on Freepik I would love to start August’s digest with another great article by Karl Wiegers.
In this article, I have listed these roles, listed down their responsibilities and their core skills. Data Visualization Specialist/Designer These experts convey trends and insights through visual data. Data Visualization Specialist/Designer These experts convey trends and insights through visual data.
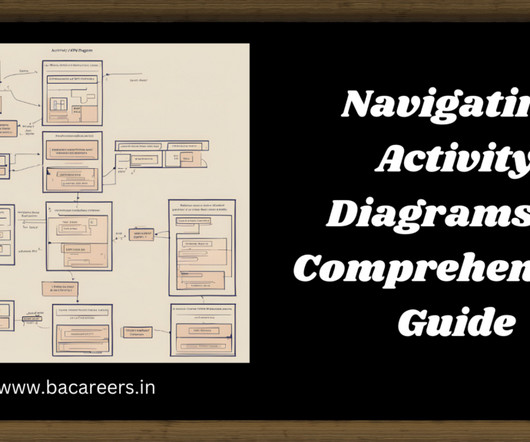
In the realm of software engineering, visual representations play a crucial role in understanding and communicating complex processes. One such tool is the Activity Diagram, a graphical illustration that depicts the flow of activities within a system.
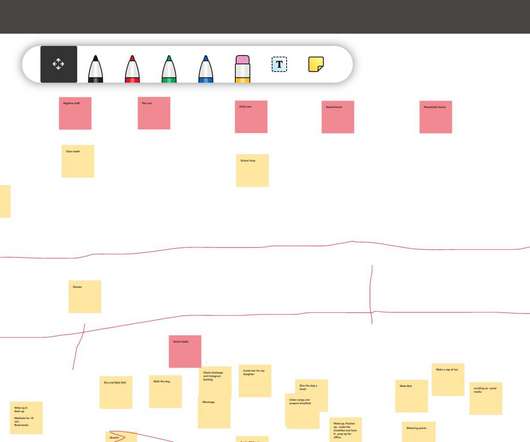
This article assumes you are already using a conference collaboration tool such as Microsoft Teams or Zoom. Scenario 4 – Drawing out business process models or any standard visual model. This enables you to draw out BPMN process flows, Wireframes, UML, Mind maps, Flow charts etc. Tool – Draw.io.
Use case is a type of UML diagram and it’s a visual way of capturing requirements. It’s not a visual format but rather it’s a textual format. To start with, use cases are visual diagrams whereas user stories are textual format. There’s no standard format for user stories.
In this article, we try to explore these underlying competencies, apply those to real-life scenarios in a Business Analyst’s work and grasp the inherent need of applying them in the right manner. Visual Thinking. It can also be used to bring clarity to visual based applications using wireframes. Creative Thinking.
A simple, clear, and easily understood visual (with just enough detail) to support the conversation. Another common approach is to use a process mapping tool based on BPMN or UML. These can work really well for detailed mapping and have the benefit of the visual.
In this article, we’ll show you everything you need to know about streamlining your organization’s processes to boost your efficiency. It consists of building a visual representation of a process to understand all its components. UML diagrams. Let’s start with a basic question. What is a business process? Data flow diagrams.
In this article, we’ll explore the concept of data modeling, including its importance, types , and best practices. Data modeling involves creating a detailed visual representation of an information system or its components. What is a Data Model? Data models help us understand and utilize data within any system.
In this article we cover the 2 nd and 3 rd aspects of the underlying competencies for a Business Analyst as per BABOK namely Behavioral Characteristics and Business Knowledge. For example, some stakeholders prefer visual representation (flowcharts, UML diagrams…) over textual format (use cases, tabular charts).
What is the UML Sequence Diagram Do you know how to create UML Sequence Diagram? UML Sequence Diagrams are vital for modeling the dynamic behavior of a system. They offer a detailed, visual representation of interactions between objects or components over time. I am sure that many of you do know that.
What is the UML Class Diagram Do you know how to create UML Class Diagram? UML Class Diagrams are essential for modeling the structure of a system. They provide a detailed, visual representation of the systems classes, their attributes, operations, and relationships. I am sure that many of you do know that.
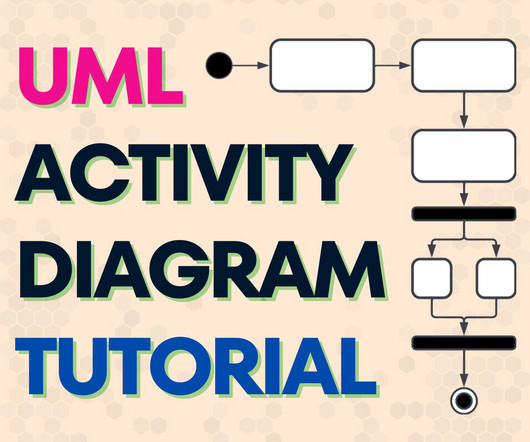
What is the UML Activity Diagram Do you know how to create UML Activity Diagram? UML Activity Diagrams are perfect for illustrating workflows or processes. By providing a visual representation of workflows, these diagrams bridge the gap between technical and non-technical stakeholders.
Models are needed in order to visualize a concept, a problem, or a process. Once you visualize it, it is easier to discuss about it, because your counterpart doesn’t have to guess what you mean and interpret your words — in this way, models help people to be on the same page. The easiest way to model the reality is to draw a diagram.
We organize all of the trending information in your field so you don't have to. Join 57,000+ users and stay up to date on the latest articles your peers are reading.
You know about us, now we want to get to know you!
Let's personalize your content
Let's get even more personalized
We recognize your account from another site in our network, please click 'Send Email' below to continue with verifying your account and setting a password.


Let's personalize your content