This site uses cookies to improve your experience. To help us insure we adhere to various privacy regulations, please select your country/region of residence. If you do not select a country, we will assume you are from the United States. Select your Cookie Settings or view our Privacy Policy and Terms of Use.
Cookie Settings
Cookies and similar technologies are used on this website for proper function of the website, for tracking performance analytics and for marketing purposes. We and some of our third-party providers may use cookie data for various purposes. Please review the cookie settings below and choose your preference.
Used for the proper function of the website
Used for monitoring website traffic and interactions
Cookie Settings
Cookies and similar technologies are used on this website for proper function of the website, for tracking performance analytics and for marketing purposes. We and some of our third-party providers may use cookie data for various purposes. Please review the cookie settings below and choose your preference.
Strictly Necessary: Used for the proper function of the website
Performance/Analytics: Used for monitoring website traffic and interactions
Automation is Redefining FinancialAnalysis In the ever-evolving landscape of finance, financialanalysis automation is no longer a mere buzzword but a pivotal component of successful business strategies. Feasibility of Automated FinancialAnalysis You might be asking yourself, can financialanalysis really be automated
5) The Role Of Visuals In Accountant Reports. Tracking the financial health of a business and its evolution over time is essential: to organize important business transactions, and keep track of invoices, but also for legal purposes. The more accurate the records, the better the financialanalysis or projection.
Data analysts are specialists in statistics, mathematics, and computer science, enabling them to serve in a variety of departments, including operations analysis, financialanalysis, and marketing analysis.
Here we take the time to define business report, explore visual report examples, and look at how to write one for various needs, goals, and objectives. In the process, we will use an online data visualization software that lets us interact with, and drill deeper into bits and pieces of relevant data. Let’s get started.
Financialanalysis and reporting are one of the bedrocks of modern business. While you may already know that financial reporting is important (mainly because it’s a legal requirement in most countries), you may not understand its untapped power and potential. Let’s start by exploring a financial reporting definition.
Online data visualization is taking precedence in business operations, creating more efficient and faster workspaces. Download: A pocket-sized guide to invaluable financial graphs and charts. What Are Financial Graphs? Why You Need FinancialAnalysis Graphs? That said, let’s get started. click to enlarge**.
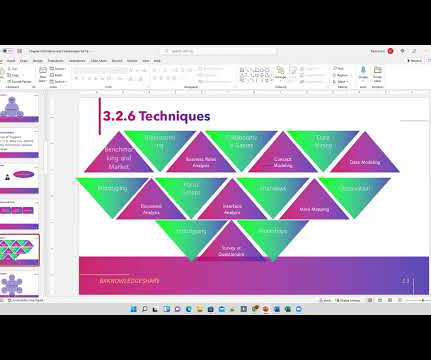
It also has a list of 50 techniques that ensure consistency and effectiveness in the application of business analysis, which is the topic of today’s article What is the BABOK® Guide? The Business Analysis Body of Knowledge (BABOK® Guide v3) provides knowledge areas, tasks, and techniques to help the business analyst do their job.
Moreover, a host of ad hoc analysis or reporting platforms boast integrated online data visualization tools to help enhance the data exploration process. This reduces the reliance on software developers or IT personnel for simple analysis and reporting. Easy to use: .
Your Chance: Want to visualize & track supply chain metrics with ease? Your Chance: Want to visualize & track supply chain metrics with ease? Please, see the bottom of this article to take a closer look at a supply chain KPI dashboard. But first, let’s start with the basic definition. What Are Supply Chain Metrics?
Fortunately, with the advent of automation technologies, financial reporting has undergone a significant transformation, paving the way for more streamlined and efficient practices. In this article, we will explore the power of automation in simplifying financial reporting and its numerous benefits.
Data visualization tools such as executive dashboards make it possible for a broader audience to grasp the meaning behind the data, identifying patterns and trends with relative ease. While that may have some very real economic benefits supported by financialanalysis, there is an important human component that you should not overlook.
Whether it’s for financialanalysis, market research, or operational insights, reporting plays a vital role in driving business success. In this article, we’ll explore a step-by-step process to elicit reporting requirements effectively. Ensure that you have access to and can extract data from these sources.
Corporate (or enterprise) dashboards are dynamic digital and visual tools that offer a comprehensive working insight into a wide range of corporate or company’s metrics and data, focused on monitoring, optimization, and achievement of strategic goals. Humans are visual creatures. What Is A Corporate Dashboard? 2) CTO dashboard.
This article will explain how powerful online spreadsheet software can help you grow your business. There are limited visualization options, and reporting becomes harder as your data gets more complex. You can change font types and sizes or use a unique visual format to create graphs and charts of your choice. Get started.
Statistical Analysis : Using statistics to interpret data and identify trends. Data Visualization : Presenting data visually to make the analysis understandable to stakeholders. Visualization: The ability to represent data visually, making it easier to understand, interpret, and derive insights.
In this article, we explore key responsibilities for data teams that help organizations navigate M&A successfully. This process involves verifying, investigating, and auditing the financial and operational aspects of the deal (source). One of the most important aspects of due diligence is financialanalysis.
Learn More EPM solutions bring together financial planning, performance measurement, and operational strategies into one seamless system. They empower your finance team to analyze, optimize, and predict financial performance, helping your organization achieve long-term objectives.
We organize all of the trending information in your field so you don't have to. Join 57,000+ users and stay up to date on the latest articles your peers are reading.
You know about us, now we want to get to know you!
Let's personalize your content
Let's get even more personalized
We recognize your account from another site in our network, please click 'Send Email' below to continue with verifying your account and setting a password.


Let's personalize your content