This site uses cookies to improve your experience. To help us insure we adhere to various privacy regulations, please select your country/region of residence. If you do not select a country, we will assume you are from the United States. Select your Cookie Settings or view our Privacy Policy and Terms of Use.
Cookie Settings
Cookies and similar technologies are used on this website for proper function of the website, for tracking performance analytics and for marketing purposes. We and some of our third-party providers may use cookie data for various purposes. Please review the cookie settings below and choose your preference.
Used for the proper function of the website
Used for monitoring website traffic and interactions
Cookie Settings
Cookies and similar technologies are used on this website for proper function of the website, for tracking performance analytics and for marketing purposes. We and some of our third-party providers may use cookie data for various purposes. Please review the cookie settings below and choose your preference.
Strictly Necessary: Used for the proper function of the website
Performance/Analytics: Used for monitoring website traffic and interactions
CHARLESMINGUS Overview The appeal of visualization is rooted in biology. The brain simply processes images better than words, devoting more than half its processing power to this task; the human eye tends to seek out and focus on visual stimuli that are easy to recognize including color, shapes, and patterns. Thats creativity.
The merits of Agile versus Waterfall are well documented. This article attempts to provide a visual, relative comparison between: A traditional Waterfall method that […]. This article attempts to provide a visual, relative comparison between: A traditional Waterfall method that […].
The ability to extract key data points from a document accurately and timely is invaluable for businesses as decision-making depends on it. In a bid to enhance their existing document management and processing workflows, business and data leaders often engage in the OCR vs. IDP debate. IDP stands for intelligent document processing.
In the previous post , I spoke about documenting user story acceptance criteria using text. In this article, I want to speak about more visual formats for spelling out requirements and acceptance criteria. Overall, we are talking about a full day of work spent on documenting requirements. Then, an idea came to me.
Nowadays, terms like ‘Data Analytics,’ ‘Data Visualization,’ and ‘Big Data’ have become quite popular. Some prominent banking institutions have gone the extra mile and introduced software to analyze every document while recording any crucial information that these documents may carry. The Underlying Concept.
k-means Clustering – Document clustering, Data mining. Besides data mining, this tool is in-demand in the following fields: Market segmentation; Document clustering; Image segmentation; Pattern recognition; Insurance fraud detection and others. As a visualization tool – PCA is great at showing a bird’s view of the process.
In this article, I will provide a simple framework to help you start a new project. Perform a document analysis of any publicly available document on the domain. Read any existing documentation , meeting notes, or important emails about the project. Here is an article on expectations for a BA. What to do first?
Such API interactions should be appropriately defined and documented for a Client, requiring several API calls with some additional actions. As a product owner or business analyst, you can either (1) provide documentation for a Client describing a workflow of API calls or (2) define internal logic for API calls under BFF/APIGateway.
Here are some book recommendations covering everything from the product process and discovery interviews to problem framing and documentation. The output is a visual representation of work to be done, which then allows us to plan iterations and/or releases, discuss priorities, etc. But these books are not only about techniques.
Effective Data Visualization Techniques In todays data-driven world, the ability to present data clearly and effectively is essential. Data visualization transforms complex data into visual formats like charts, graphs, and dashboards, making it easier to analyze, interpret, and communicate insights.
In this article, we’ll explore their ins and outs. Earlier this year, embedded software consultant Jacob Beningo wrote an insightful article on the future of embedded AI software. Popular options include Atmel Studio, Eclipse, Visual Studio Code, and Keil MDK. Several steps are involved in embedded software development.
Last year, we published an article on the ways that big law and big data are intersecting. With e-Discovery legal analytics tools, you can filter documents by data range instead of delving through mountains of documents or focus on only those containing the exact keywords. But what is legal analytics? Predictive analytics.
This article highlights key moments from the event. The AI agents leverage LLMs as their brain to reason through data from tables, documents, or functions/APIs. Finally, he introduced AI/BI dashboards, a visualization feature within the Databricks environment. Databricks Data Intelligence Day, March 27, 2025, Amsterdam.
This article explores practices proposed by the International Institute of Business Analysis (IIBA®) that make Product Owners excel in their work. But also because the job of BAs focused on gathering requirements upfront, and writing heavy documents didn’t make any sense anymore. Because most frameworks didn’t include such role.
Time management simplified Photo by Aron Visuals on Unsplash So far For those of you who have read my articles here so far, I have written on a broad range of business analysis techniques. A physical white board can be used to take down notes to track updates, see a visual overview, etc.
This final article in our series on Agile Business Analysis principles explores the principle Avoid Waste. Waste can take many forms, such as redundant features, excessive documentation, misaligned priorities, or inefficient communication. For example, models, or evolving documents. user manuals).
This article examines the psychology of business analysis in agile software development and how it can be applied to produce the best results. For example, some stakeholders may prefer visual aids, while others may prefer written documentation.
They can also use visual data to better conceptualize their tax situations. Fortunately, data analytics makes it easier to address them by quickly reviewing documents before filing. Hope you enjoyed the article. Dealing with Filing Issues. Another headache for businesses is to reduce the filing issues. Taking Care of Audit.
“By visualizing information, we turn it into a landscape that you can explore with your eyes. 90% of the information transmitted to the brain is visual. Data visualization methods refer to the creation of graphical representations of information. That’s where data visualization comes in. A sort of information map.
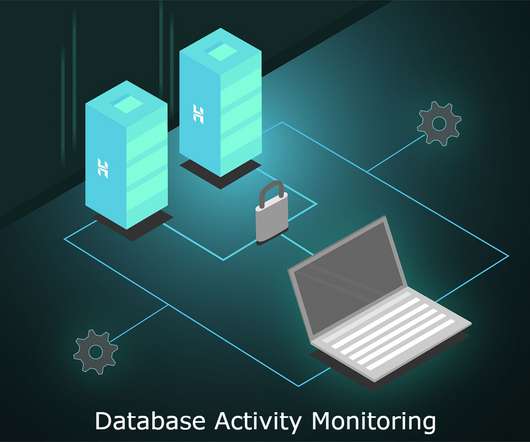
This article will provide the answers. In addition, well-known products boast a lot of implementations and use cases that are comprehensively reflected in the documentation. What are the ties between DAM and data loss prevention (DLP) systems? Does DAM need a user behavior analytics (UBA) module? How do DAM solutions work?
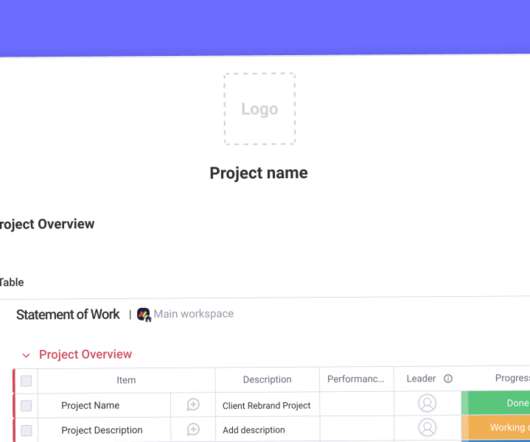
Creating a procedure document that users can follow thus becomes a key activity for business analysts that needs to be completed so that system users can perform their duties using the new system or process on day one. Are you looking to create a procedure document?
That inspired me to write this article. However, you have people with whom you could collaborate (yes, the partners mentioned above — #2) to make sure that you collected/documented all the necessary requirements. Collaborate until you reach shared understanding then document. So in some way my coaching was a therapy for them.
5) The Role Of Visuals In Accountant Reports. In this article, we will go over the different types of basic accounting reports, why you need them and how you can present them – this last point is crucial in the communication of your financial story, especially when we consider all that is at stake with accountancy. Table of Contents.
Welcome to the Business Analysis Digest #37, with the best business analysis and related topics articles of August 2023. Business Analysis Articles 15 Tips for Outsourced Software Development Success by Karl Wiegers Image by wirestock on Freepik I would love to start August’s digest with another great article by Karl Wiegers.
analytics extensions have allowed Tableau users to dynamically bring sophisticated analysis and integrations into their visualizations. For more information, check out our product documentation. . Materials on using TabPy for visual analytics (the first link is for TC20, the talk is called Operationalizing Data Science).
Mastering Software Requirements Elicitation and Documentation for Successful Adoption In the ever-evolving landscape of technology, the process of software selection and adoption has become a crucial decision for businesses aiming to enhance their operations and stay competitive. Learn More About RML® 6.
Reflecting on the previous year, I’ve noticed a few strong trends in our articles. In this issue of Analyst’s corner digest we’ve got the articles about: Requirements elicitation: building partnerships and committing to good requirements, asking the right questions and an intriguing: Why do we ask the most important question — “Why?” . >
In this article, we are going to discuss BPMN certification and its implementation while considering its methods, examples, elements, and all the other relevant information that you need to know. It uses symbols and notations to create visual models for business processes BPMN 2.0
There are several popular Python IDEs available, such as PyCharm, Spyder, and Visual Studio Code. For beginners, we recommend using Jupyter Notebook, which is an open-source web application that allows you to create and share documents that contain live code, equations, visualizations, and narrative text.
The job isn’t finished until the paperwork is done, or in this day and age, until the documents have been filed. Organizations of all shapes and sizes are taking a deeper look into how they’re managing their documents, and they’re making investments to improve. What is document management? billion by 2023.
In this article, we will discuss how sales automation works and how to use automation to optimize your sales process. For instance, it can analyze the unanswered questions and recommend solutions in a personalized document that you can automatically send to your lead. Smart companies are using big data to make it possible.
In this comprehensive article, we will share valuable tips and tricks for securing your ideal data science job, guiding you through the process of building a strong foundation, showcasing your skills, and acing the interview. These languages offer extensive libraries and tools for data analysis, visualization, and machine learning.
Another notorious characteristic of legacy systems is outdated or lack of documentation. Documentation of an ancient business rule. But later in the article, it provides a bit of a conflicting statement with the definition mentioned above: Business logic should be distinguished from business rules.
In this article, I delve into the most frequent challenges an IT business analyst faces in custom software development. Document everything using tools like user stories, use-case diagrams, and Business Requirement Documents (BRD). Consider training sessions, and ensure proper documentation is available for them.
This article is the first of two on the topic of Data Management. In the second of these two articles entitled, ‘Factors and Considerations Involved in Choosing a Data Management Solution’, we discuss the various factors and considerations that a business should include when it is ready to choose a data management solution.
This article is the first of two on the topic of Data Management. In the second of these two articles entitled, ‘Factors and Considerations Involved in Choosing a Data Management Solution’, we discuss the various factors and considerations that a business should include when it is ready to choose a data management solution.
Have you ever looked at a BRD (business requirement document) template and wondered what purpose it serves? In this article, you’ll learn what exactly a business requirement document is, why you might want to use one, and what to include in it. What is a business requirement document? Get the template.
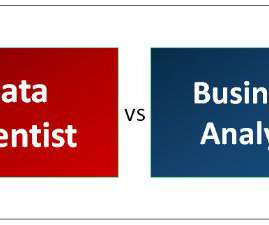
We will look at the work done by both professionals and cover the similarities and differences in this article. The BA will identify all the stakeholders involved, assess the organization’s current processes, set timelines, define measurable objectives, requirement elicitation, and documentation. What Is a Business Analyst?
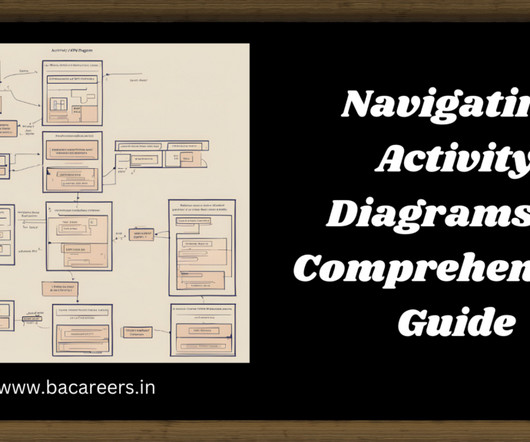
In the realm of software engineering, visual representations play a crucial role in understanding and communicating complex processes. One such tool is the Activity Diagram, a graphical illustration that depicts the flow of activities within a system.
As a Business Analyst, which documents have you prepared? A Business Analyst (BA) is responsible for preparing various documents as part of their role. In the SRS document, assumptions are added for risk management analysis. Hence it becomes crucial to include assumptions and constraints in the SRS document.
> Keep reading… 3) Identifying and documenting business rules by Karl Wiegers My friend Jeremy visited his local blood bank’s website and made an appointment to donate blood later that day. In this article, I will provide a simple framework to help you start a new project. Join me in a little bit of dreaming about the future.
The Bespoke Metrics Analytics team will brainstorm with the client to discover valuable ways to utilize, customize, and visualize the data to enhance their experience. To learn more about how the tool works, check out our latest article, 3 Ways Domo Everywhere Can Generate Revenue, Cut Costs, and Better Your Business.
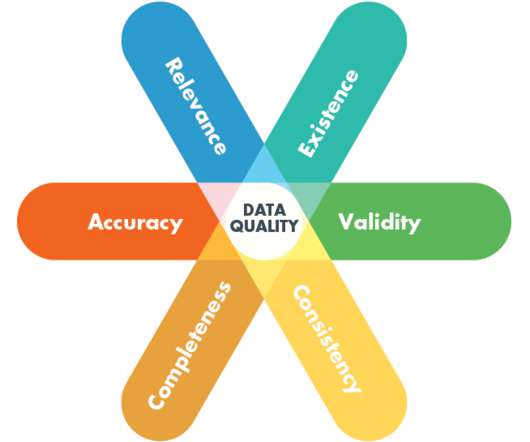
These are terms that need to be carefully defined and documented so we can move on to how we are going to improve them. Here’s an overview article from Neil Patel about assessing data quality. Habit 2: Create a shared vocabulary for your data What is an “active user”? How do we track “first success” for a user?
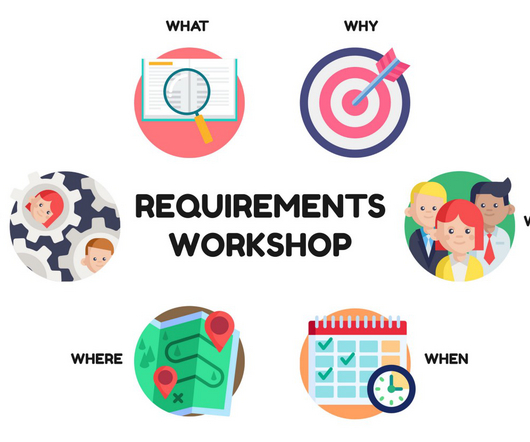
Document and summarize the action items. In addition, you can find an example of the 7Ps technique in this article in the BA Times. Use visuals whenever possible. Workflow diagrams, lightweight prototypes, and wireframes help people visualize concepts. Determine the appropriate time and length of the meeting.
We organize all of the trending information in your field so you don't have to. Join 57,000+ users and stay up to date on the latest articles your peers are reading.
You know about us, now we want to get to know you!
Let's personalize your content
Let's get even more personalized
We recognize your account from another site in our network, please click 'Send Email' below to continue with verifying your account and setting a password.


Let's personalize your content