This site uses cookies to improve your experience. To help us insure we adhere to various privacy regulations, please select your country/region of residence. If you do not select a country, we will assume you are from the United States. Select your Cookie Settings or view our Privacy Policy and Terms of Use.
Cookie Settings
Cookies and similar technologies are used on this website for proper function of the website, for tracking performance analytics and for marketing purposes. We and some of our third-party providers may use cookie data for various purposes. Please review the cookie settings below and choose your preference.
Used for the proper function of the website
Used for monitoring website traffic and interactions
Cookie Settings
Cookies and similar technologies are used on this website for proper function of the website, for tracking performance analytics and for marketing purposes. We and some of our third-party providers may use cookie data for various purposes. Please review the cookie settings below and choose your preference.
Strictly Necessary: Used for the proper function of the website
Performance/Analytics: Used for monitoring website traffic and interactions
When an organization is considering a business intelligence solution, it will often focus on one primary need, e.g., datavisualization, datadiscovery, BI self-service etc. However, that user may not have the time or the analytical skills to find, gather and perform complex analysis on enterprise-wide data.
When an organization is considering a business intelligence solution, it will often focus on one primary need, e.g., datavisualization, datadiscovery, BI self-service etc. However, that user may not have the time or the analytical skills to find, gather and perform complex analysis on enterprise-wide data.
When an organization is considering a business intelligence solution, it will often focus on one primary need, e.g., datavisualization, datadiscovery, BI self-service etc. However, that user may not have the time or the analytical skills to find, gather and perform complex analysis on enterprise-wide data.
Table of Contents 1) The Benefits Of DataVisualization 2) Our Top 27 Best DataVisualizations 3) Interactive DataVisualization: What’s In It For Me? 4) Static vs. Animated DataVisualizationData is the new oil? No, data is the new soil.”
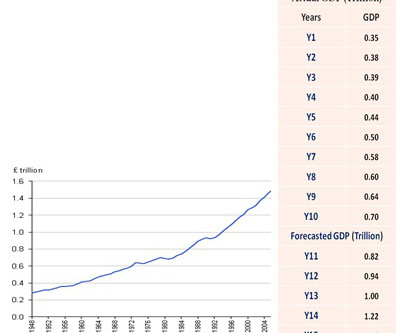
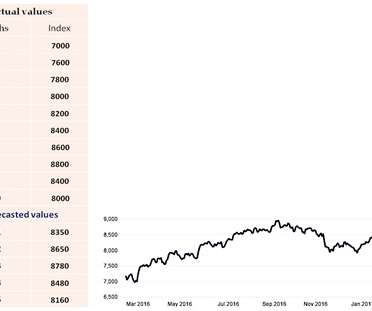
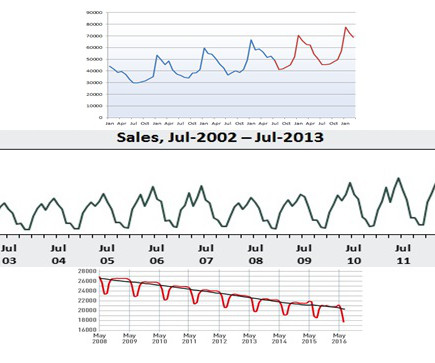
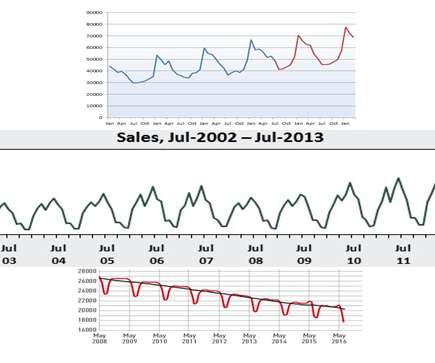
This article looks at the ARIMAX Forecasting method of analysis and how it can be used for business analysis. For more information about data trend and pattern analysis techniques, read our article entitled, ‘ What Are Data Trends and Patterns, and How Do They Impact Business Decisions?’
This article looks at the ARIMAX Forecasting method of analysis and how it can be used for business analysis. For more information about data trend and pattern analysis techniques, read our article entitled, ‘ What Are Data Trends and Patterns, and How Do They Impact Business Decisions?’
This article looks at the ARIMAX Forecasting method of analysis and how it can be used for business analysis. For more information about data trend and pattern analysis techniques, read our article entitled, ‘ What Are Data Trends and Patterns, and How Do They Impact Business Decisions?’
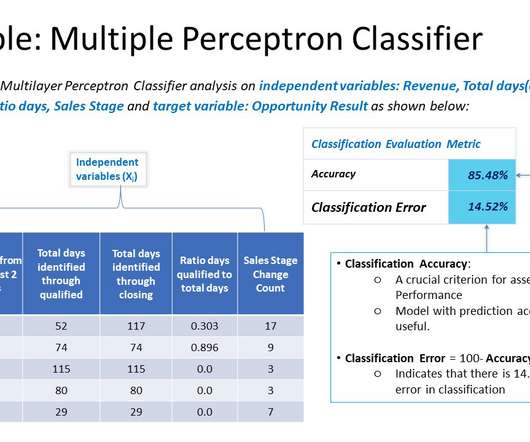
This article describes the analytical technique of multilayer perceptrons for classification. MLP’s can be applied to complex non-linear problems, and it also works well with large input data with a relatively faster performance. What is a Multilayer Perceptron Classifier?
This article describes the analytical technique of multilayer perceptrons for classification. MLP’s can be applied to complex non-linear problems, and it also works well with large input data with a relatively faster performance. What is a Multilayer Perceptron Classifier?
This article describes the analytical technique of multilayer perceptrons for classification. MLP’s can be applied to complex non-linear problems, and it also works well with large input data with a relatively faster performance. What is a Multilayer Perceptron Classifier?
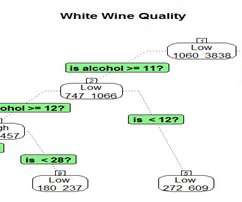
In this article, we will discuss the Decision Tree analysis method. 1) Classification Trees are used when the target variable is categorical and, as the name implies, are used to classify/divide the data into these predefined categories of a target variable. What is Decision Tree Analysis?
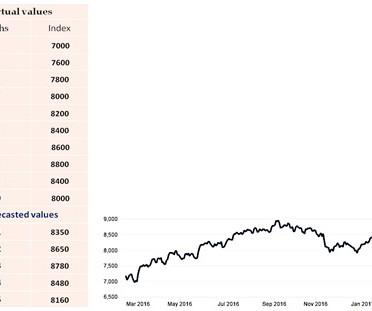
This article provides a brief explanation of the ARIMA method of analytical forecasting. This analytical forecasting method is suitable for instances when data is stationary/non stationary and is univariate, with any type of data pattern, i.e., level/trend/seasonality/cyclicity. What is ARIMA Forecasting?
This article provides a brief explanation of the ARIMA method of analytical forecasting. This analytical forecasting method is suitable for instances when data is stationary/non stationary and is univariate, with any type of data pattern, i.e., level/trend/seasonality/cyclicity. What is ARIMA Forecasting?
This article provides a brief explanation of the ARIMA method of analytical forecasting. This analytical forecasting method is suitable for instances when data is stationary/non stationary and is univariate, with any type of data pattern, i.e., level/trend/seasonality/cyclicity. What is ARIMA Forecasting?
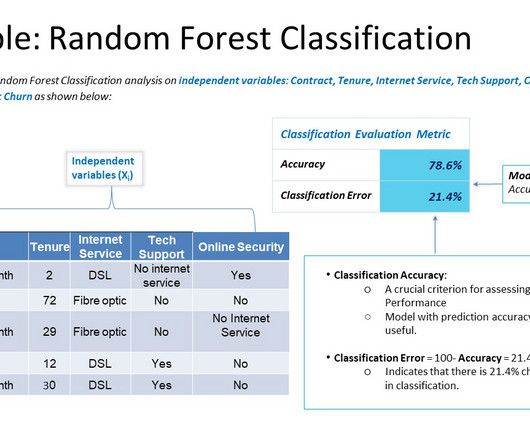
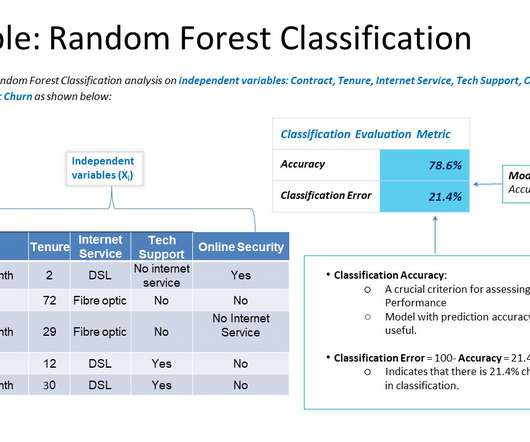
This article provides a brief overview of random forest classification technique. The Smarten approach to datadiscovery is designed as an augmented analytics solution to serve business users. What is Random Forest Classification?
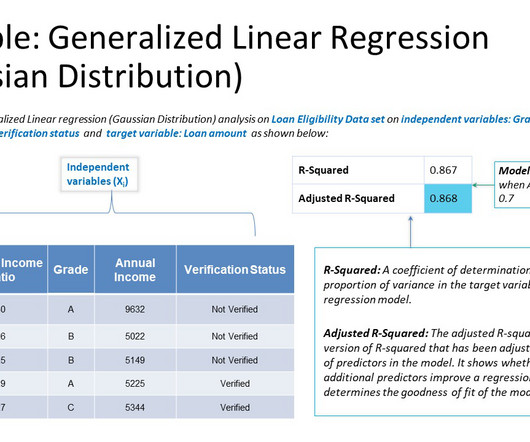
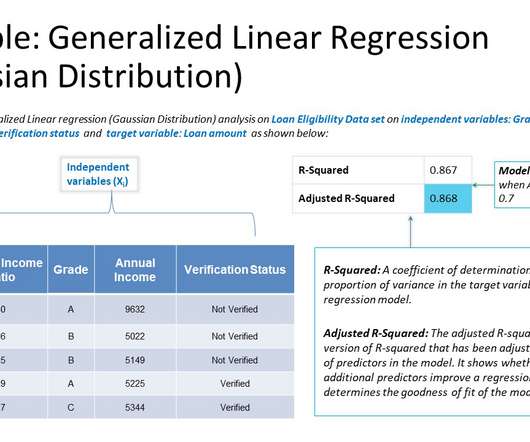
This article describes the analytical technique of generalized linear regression with gaussian distribution. The Smarten approach to datadiscovery is designed as an augmented analytics solution to serve business users. What is Generalized Linear Regression with Gaussian Distribution?
This article provides a brief overview of random forest classification technique. The Smarten approach to augmented analytics and modern business intelligence focuses on the business user and provides tools for Advanced DataDiscovery so users can perform early prototyping and test hypotheses without the skills of a data scientist.
This article describes the analytical technique of generalized linear regression with gaussian distribution. The Smarten approach to datadiscovery is designed as an augmented analytics solution to serve business users. What is Generalized Linear Regression with Gaussian Distribution?
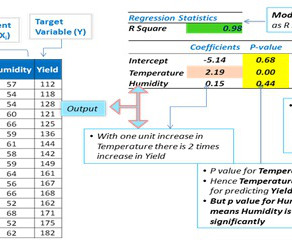
This article describes the analytical technique of multiple linear regression. The Smarten approach to augmented analytics and modern business intelligence focuses on the business user and provides tools for Advanced DataDiscovery so users can perform early prototyping and test hypotheses without the skills of a data scientist.
This article provides a brief overview of random forest classification technique. The Smarten approach to augmented analytics and modern business intelligence focuses on the business user and provides tools for Advanced DataDiscovery so users can perform early prototyping and test hypotheses without the skills of a data scientist.
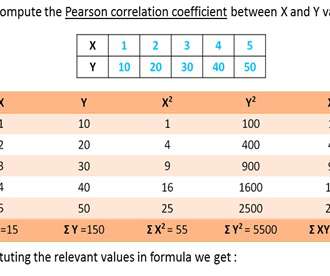
This article explains the Karl Pearson Correlation method of analysis, and how it can be applied in business. The Smarten approach to datadiscovery is designed as an augmented analytics solution to serve business users. What is the Karl Pearson Correlation Analytical Technique?
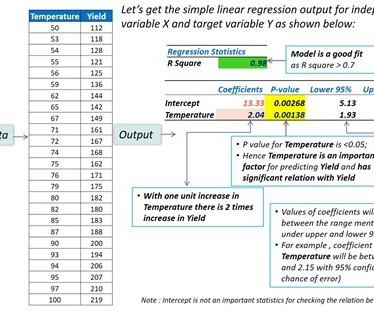
This article describes the Simple Linear Regression method of analysis. About Smarten The Smarten approach to augmented analytics and modern business intelligence focuses on the business user and provides tools for Advanced DataDiscovery so users can perform early prototyping and test hypotheses without the skills of a data scientist.
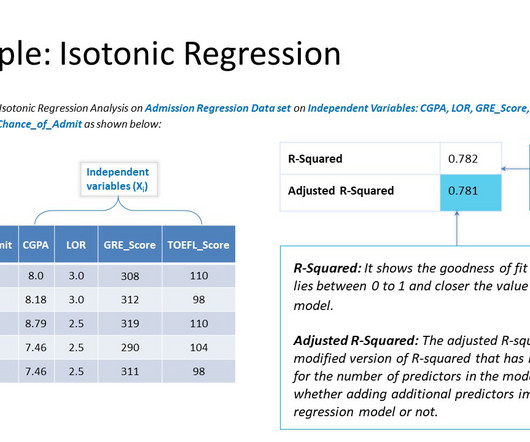
This article provides a brief overview of isotonic regression technique. About Smarten The Smarten approach to augmented analytics and modern business intelligence focuses on the business user and provides tools for Advanced DataDiscovery so users can perform early prototyping and test hypotheses without the skills of a data scientist.
This article explains the Karl Pearson Correlation method of analysis, and how it can be applied in business. The Smarten approach to datadiscovery is designed as an augmented analytics solution to serve business users. What is the Karl Pearson Correlation Analytical Technique?
This article describes the Simple Linear Regression method of analysis. About Smarten The Smarten approach to augmented analytics and modern business intelligence focuses on the business user and provides tools for Advanced DataDiscovery so users can perform early prototyping and test hypotheses without the skills of a data scientist.
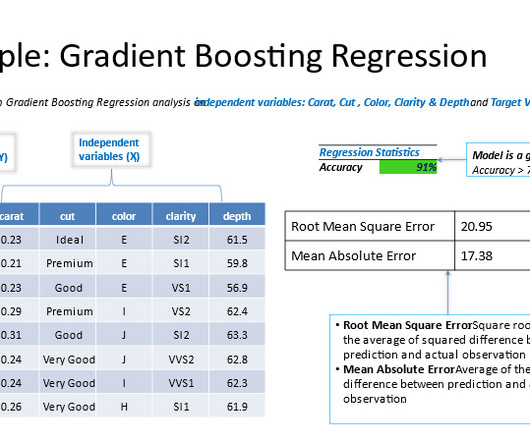
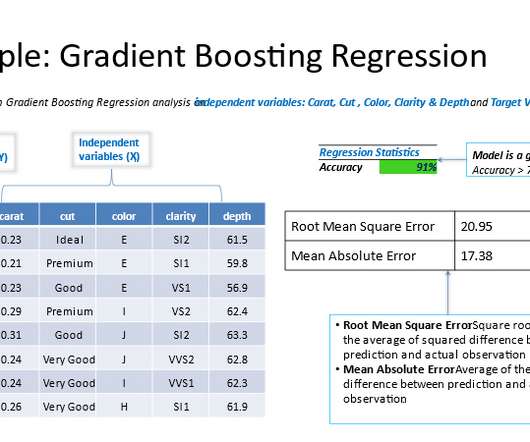
This article describes the analytical technique of gradient boosting regression. The Smarten approach to datadiscovery is designed as an augmented analytics solution to serve business users. What is Gradient Boosting Regression?
This article provides a brief overview of isotonic regression technique. The Smarten approach to augmented analytics and modern business intelligence focuses on the business user and provides tools for Advanced DataDiscovery so users can perform early prototyping and test hypotheses without the skills of a data scientist.
This article provides a brief overview of isotonic regression technique. The Smarten approach to augmented analytics and modern business intelligence focuses on the business user and provides tools for Advanced DataDiscovery so users can perform early prototyping and test hypotheses without the skills of a data scientist.
This article describes the analytical technique of gradient boosting regression. The Smarten approach to augmented analytics and modern business intelligence focuses on the business user and provides tools for Advanced DataDiscovery so users can perform early prototyping and test hypotheses without the skills of a data scientist.
This article explains the Karl Pearson Correlation method of analysis, and how it can be applied in business. The Smarten approach to business intelligence and business analytics focuses on the business user and provides Advanced DataDiscovery so users can perform early prototyping and test hypotheses without the skills of a data scientist.
This article describes the Simple Linear Regression method of analysis. The Smarten approach to business intelligence and business analytics focuses on the business user and provides Advanced DataDiscovery so users can perform early prototyping and test hypotheses without the skills of a data scientist.
In this article, we will focus on the identification and exploration of data patterns and the trends that data reveals. In this article, we have reviewed and explained the types of trend and pattern analysis. Every dataset is unique, and the identification of trends and patterns in the underlying the data is important.
In this article, we will focus on the identification and exploration of data patterns and the trends that data reveals. In this article, we have reviewed and explained the types of trend and pattern analysis. Every dataset is unique, and the identification of trends and patterns in the underlying the data is important.
In this article, we will focus on the identification and exploration of data patterns and the trends that data reveals. In this article, we have reviewed and explained the types of trend and pattern analysis. Every dataset is unique, and the identification of trends and patterns in the underlying the data is important.
This article presents a brief explanation of Outliers, and how this type of analysis is used. An outlier is an element of a data set that distinctly stands out from the rest of the data. In other words, outliers are those data points that lie outside the overall pattern of distribution as shown in figure below.
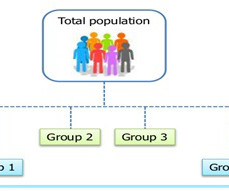
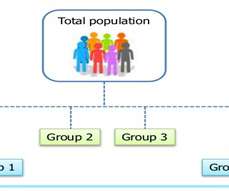
This article discusses the analytical method of Hierarchical Clustering and how it can be used within an organization for analytical purposes. The Smarten approach to datadiscovery is designed as an augmented analytics solution to serve business users. What is Hierarchical Clustering?
This article describes the analytical technique of multiple linear regression. About Smarten The Smarten approach to augmented analytics and modern business intelligence focuses on the business user and provides tools for Advanced DataDiscovery so users can perform early prototyping and test hypotheses without the skills of a data scientist.
This article presents a brief explanation of Outliers, and how this type of analysis is used. An outlier is an element of a data set that distinctly stands out from the rest of the data. In other words, outliers are those data points that lie outside the overall pattern of distribution as shown in figure below.
This article discusses the analytical method of Hierarchical Clustering and how it can be used within an organization for analytical purposes. The Smarten approach to datadiscovery is designed as an augmented analytics solution to serve business users. What is Hierarchical Clustering?
This article describes the analytical technique of multiple linear regression. About Smarten The Smarten approach to augmented analytics and modern business intelligence focuses on the business user and provides tools for Advanced DataDiscovery so users can perform early prototyping and test hypotheses without the skills of a data scientist.
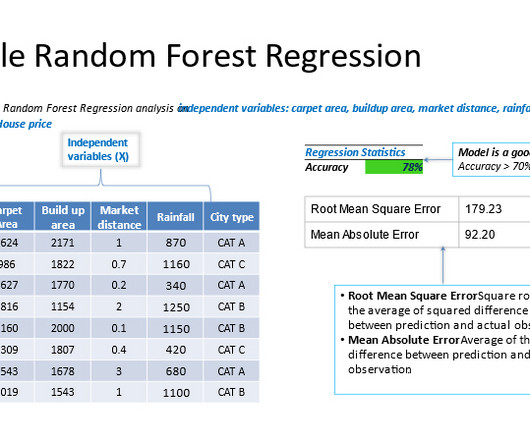
This article describes the analytical technique of random forest regression. About Smarten The Smarten approach to augmented analytics and modern business intelligence focuses on the business user and provides tools for Advanced DataDiscovery so users can perform early prototyping and test hypotheses without the skills of a data scientist.
This article describes the analytical technique of random forest regression. The Smarten approach to augmented analytics and modern business intelligence focuses on the business user and provides tools for Advanced DataDiscovery so users can perform early prototyping and test hypotheses without the skills of a data scientist.
This article presents a brief explanation of Outliers, and how this type of analysis is used. An outlier is an element of a data set that distinctly stands out from the rest of the data. In other words, outliers are those data points that lie outside the overall pattern of distribution as shown in figure below.
This article discusses the analytical method of Hierarchical Clustering and how it can be used within an organization for analytical purposes. All of these tools are designed for business users with average skills and require no special skills or knowledge of statistical analysis or support from IT or data scientists.
We organize all of the trending information in your field so you don't have to. Join 57,000+ users and stay up to date on the latest articles your peers are reading.
You know about us, now we want to get to know you!
Let's personalize your content
Let's get even more personalized
We recognize your account from another site in our network, please click 'Send Email' below to continue with verifying your account and setting a password.


Let's personalize your content