This site uses cookies to improve your experience. To help us insure we adhere to various privacy regulations, please select your country/region of residence. If you do not select a country, we will assume you are from the United States. Select your Cookie Settings or view our Privacy Policy and Terms of Use.
Cookie Settings
Cookies and similar technologies are used on this website for proper function of the website, for tracking performance analytics and for marketing purposes. We and some of our third-party providers may use cookie data for various purposes. Please review the cookie settings below and choose your preference.
Used for the proper function of the website
Used for monitoring website traffic and interactions
Cookie Settings
Cookies and similar technologies are used on this website for proper function of the website, for tracking performance analytics and for marketing purposes. We and some of our third-party providers may use cookie data for various purposes. Please review the cookie settings below and choose your preference.
Strictly Necessary: Used for the proper function of the website
Performance/Analytics: Used for monitoring website traffic and interactions
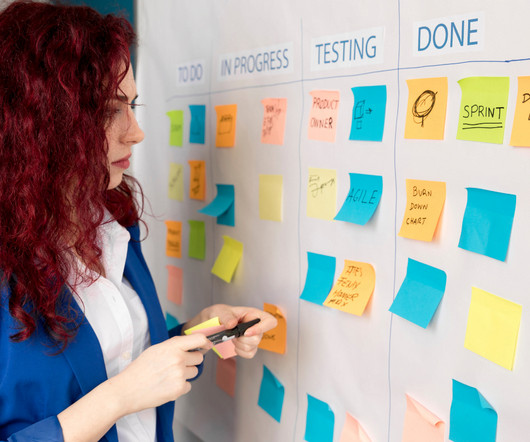
Agility for any organization is the ability to stay alert and be prepared to act on any decision almost instantly. Agile software development is a collaborative process between and within project teams with an ingrained set of values and principles for software development.
Agility for any organization is the ability to stay alert and be prepared to act on any decision almost instantly. Agile software development is a collaborative process between and within project teams with an ingrained set of values and principles for software development.
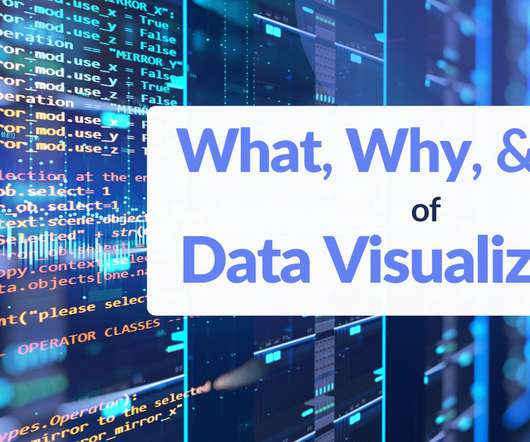
Data Visualization. Did you know visualization has been in use since (and well before that as well) 1824 AD to develop an Egyptian map – the Turin Papyrus Map. With the overwhelming volume and rate at which data grows, it is almost impossible to do it without visual help. Creating Good Visualizations.
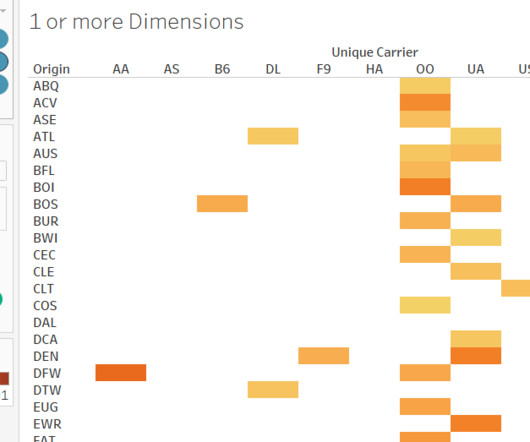
Heat and Tree Maps We are going to look at two important visualizations which are used in many different fields for analysis. Heat Maps In these visualizations, the color shade of areas varies as per the values in the data. They are great for visualizing statistical data as well.
Karam Labban has more than 20 years of professional experience as a project manager and certified Agile practitioner. While satisfied with his successes on the job, teaching students in Villanova University’s 100% online Certificate in Agile Management program. His Transition from Project Management to Agile.
Recently a fellow Agile Coach recommended General Stanley McChrystal’s Team of Teams book to me. I thought it was going to be all about the military but McChrystal has instead written a leadership book that describes how to create true agility even in a large organization. It is a great book with many lessons for Agile Leaders !
> Keep reading… Agile & SDLC 1) Managing backlog flow with the “Rock Crusher” method by Nuno Santos Managing the backlog is not always easy, given its importance. One of the most popular libraries for data visualization in Python is Seaborn. It covers the entirety of BABOK Guide, and qualifies for 35 PDUs.
Karam Labban has more than 20 years of professional experience as a project manager and certified Agile practitioner. While satisfied with his successes on the job, teaching students in Villanova University’s 100% online Certificate in Agile program allows him to tap into something he enjoys just as much. “I
This paper will help you understand the various elements which would help you in making the transition which has been outlined in the form of skills, qualifications, and the sequential steps necessary to acquire a position as a Business Analyst (BA) in the informationtechnology area. Why Consider Business Analysis in IT?
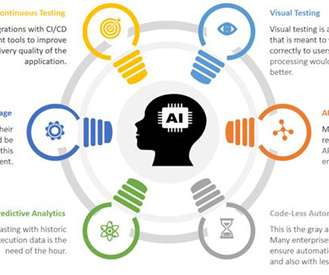
That’s why we’re breaking the concept of technologies out into two specific categories: Technology created for consumer use : This includes B2C products like the software and hardware of smartphones as well as B2B products like email marketing software. In contrast to Waterfall, Agile takes an iterative approach to managing projects.
Cprime consults organizations on agile methodologies , among other management techniques and a raft of products and technologies. The internal creative team leveraged its agile experience to create a rich, flexible, and unique visual vernacular for the company’s growing global business. Here’s how. What is iconography?
Domo has a pretty good idea as to what its customers think about its platform thanks—in part, at least—to TrustRadius , an organization that compiles reviews of software solutions so that business leaders can make more informedtechnology purchasing decisions. But that’s not all TrustRadius does.
As in many other industries, the informationtechnology sector faces the age-old issue of producing IT reports that boost success by helping to maximize value from a tidal wave of digital data. Informationtechnology reports are the interactive eyes you need to help your department run more smoothly, cohesively, and successfully.
Today’s organizations are focusing on improving the delivery of informationtechnology to the next level. DevOps focuses on the speed with which organizations deliver IT services by adopting agile and flexible practices as part of a systems-oriented approach. Rather, it’s a journey. It is not a process, technique, or standard.
DevOps is a collection of processes that integrates software development (Dev) with informationtechnology (IT) operations (Ops). . You might be interested in reading: The Ultimate Guide to DevOps, SAFe Agile, and the CALMR Approach. Monitor and visualize unified DevOps data in real-time, with metrics, traces, and logs.
A big part of success is being prepared when opportunity knocks, and having a clear and current grasp of what new technology can do is critical to your career. Informationtechnology is imbedded in everything from automobiles to household appliances, and companies use computer applications to support every facet of their business.
You might feel that Agile is unsuitable for such projects due to its iterative nature with frequent delivery. Describing business logic There are different ways of describing business logic, from textual to visual. That is all about compromises. But that is not actually true. No one is good at it, actually.
Tableau is currently one of the most powerful and fastest-growing business intelligence and visual analytics platforms in the industry. It empowers millions of users and organizations to understand their data and present it in a compelling way using easy but powerful visualizations: graphs, dashboards, and stories. About Techcanvass.
These insightful visualizations were done in Tableau. Techcanvass is an InformationTechnology certifications training Organization for professionals. Techcanvass provides CBAP Course , CCBA Course , ECBA Course and Agile Analysis Certification (AAC) Course. Find out more about Tableau in this article. About Techcanvass.
But over time, the Agile method provided a much better delivery pattern and reduced the delivery timelines for projects. There are many proven Automation Testing software available in the current world of InformationTechnology which help better address this purpose. Traditional Testing vs Shift Left Testing.
Requirements Analysis and Modelling: Learning tools & techniques for elicitation, requirements specifications, visual modelling and collaboration. Core IT methodologies (IT BA): Understand the various core software development methodologies like Agile, Waterfall, DevOps et al. Also, do practice and visualize.
The engineering team he leads is responsible for building and maintaining Microsoft Azure, Dynamics 365, Windows/Windows Server, HoloLens, Visual Studio/Visual Studio Code, GitHub, SQL Server, and Power BI. . Lydia is a seeker of input through information, opinions and experiences. Follow Gabor A Pinter on LinkedIn.
About Techcanvass We are an InformationTechnology certifications training Organization for professionals. We specializes in providing training and consulting services in a wide range of domains, including Business Analysis, Agile, Project Management, Data Analysis, Scrum, and more.
Either a strong foundation in business or in informationtechnology is required. They concentrate improvements on the goals of the stakeholders, such as increased corporate agility, access to new markets, productivity, and digital transformation.
It's a standard practice It's defined to help test the user story It's an integral component of user story 3C format It's a mandatory step of Agile methodology 5. In order to communicate business analysis information, which of the following techniques can be used for both individual and group collaboration? Graph Model Map Table 20.
We organize all of the trending information in your field so you don't have to. Join 57,000+ users and stay up to date on the latest articles your peers are reading.
You know about us, now we want to get to know you!
Let's personalize your content
Let's get even more personalized
We recognize your account from another site in our network, please click 'Send Email' below to continue with verifying your account and setting a password.


Let's personalize your content