This site uses cookies to improve your experience. To help us insure we adhere to various privacy regulations, please select your country/region of residence. If you do not select a country, we will assume you are from the United States. Select your Cookie Settings or view our Privacy Policy and Terms of Use.
Cookie Settings
Cookies and similar technologies are used on this website for proper function of the website, for tracking performance analytics and for marketing purposes. We and some of our third-party providers may use cookie data for various purposes. Please review the cookie settings below and choose your preference.
Used for the proper function of the website
Used for monitoring website traffic and interactions
Cookie Settings
Cookies and similar technologies are used on this website for proper function of the website, for tracking performance analytics and for marketing purposes. We and some of our third-party providers may use cookie data for various purposes. Please review the cookie settings below and choose your preference.
Strictly Necessary: Used for the proper function of the website
Performance/Analytics: Used for monitoring website traffic and interactions
It can be used for something as visual as reducing traffic jams, to personalizing products and services, to improving the experience in multiplayer video games. We would like to talk about data visualization and its role in the big data movement. Data is useless without the opportunity to visualize what we are looking for.
As technology continues to advance data generation across the world, it’s safe to say that investing in data solutions will be crucial to seeing business growth and success in 2022 and beyond. As a starting point, there are a number of tools that utilize data visualization for businesses. How can data help my business?
Machine learning algorithms use these sets of visual data to look for statistical patterns to identify which image features allow you to assume that it is worthy of a particular label or diagnosis. The post Top 8 Machine Learning Development Companies in 2022 appeared first on SmartData Collective.
Get visual! Want to strengthen your narrative and connect with your audience in a more lasting way? According to Brain Rules, pictures beat text and what is heard. A person remembers only 10% of the heard piece of the information three days later but retains 65% if the same information is supplemented with images. Read More.
Speaker: Marius Moscovici, CEO Metric Insights & Mike Smitheman, VP Metric Insights
To be effective, Business Intelligence (BI) governance must cover both data and visualizations. September 14th, 2022 at 9:30 am PT, 12:30 pm ET, 5:30 pm BST Organizations continually fail to generate ROI on their governance initiatives because they are too narrow in scope.
January 6, 2022 - 9:05pm. January 10, 2022. Earn the humble-bragging rights that come with qualifying for the world’s largest data visualization contest. . Then create a visualization on Tableau Public and submit your entry. Visualizing the arts. Go forth and viz to compete for global viz glory in Iron Viz 2022.
January 6, 2022 - 9:05pm. January 10, 2022. Earn the humble-bragging rights that come with qualifying for the world’s largest data visualization contest. Then create a visualization on Tableau Public and submit your entry. Visualizing the arts. Go forth and viz to compete for global viz glory in Iron Viz 2022.
The 19 Best Data Visualization Tools and Software for 2022 Results Review’s table of the stylish data visualization tools is a periodic mashup of products that stylish represent current request conditions, according to the crowd.
Data Visualization : Presenting insights via dashboards or graphs using tools like Tableau or Power BI, enabling decision-makers to act on data effectively. Data Storage : Using scalable technologies like Hadoop or cloud storage to handle vast datasets.
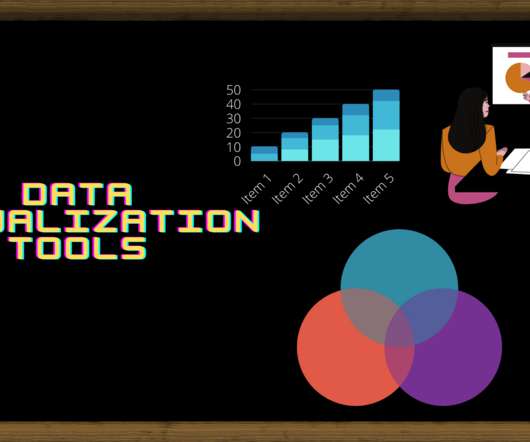
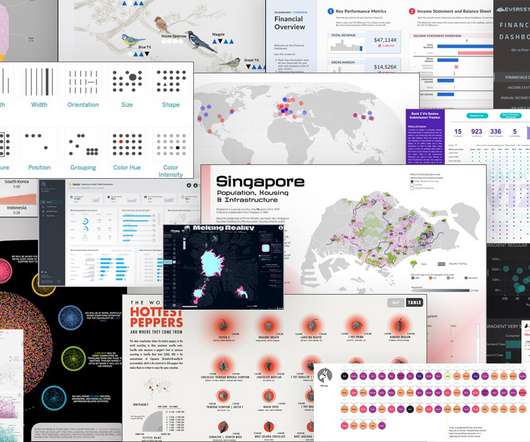
Data visualization is the portrayal of large amounts of data in the form of charts, maps, graphs, or any type of visual format to help you identify relationships and trends in data. Read More.
It can be used to run analytical tools and power data visualization as well. While we are at it, a few tools are leading in 2022. Visualizations make communicating complex information much easier in a visual form. The final point to which the data has to be eventually transferred is a destination.
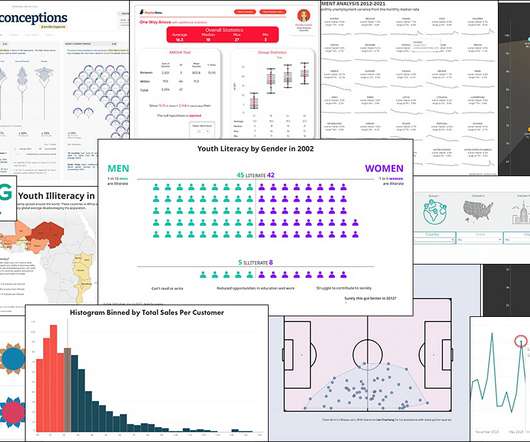
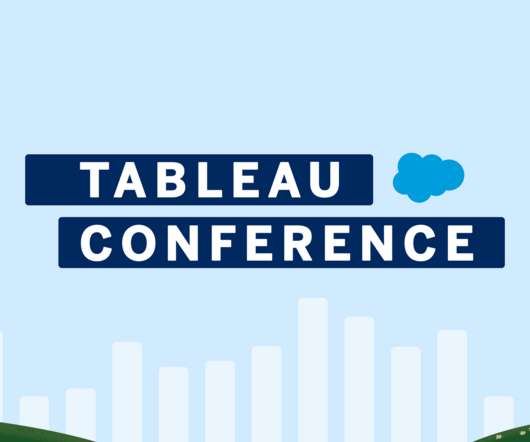
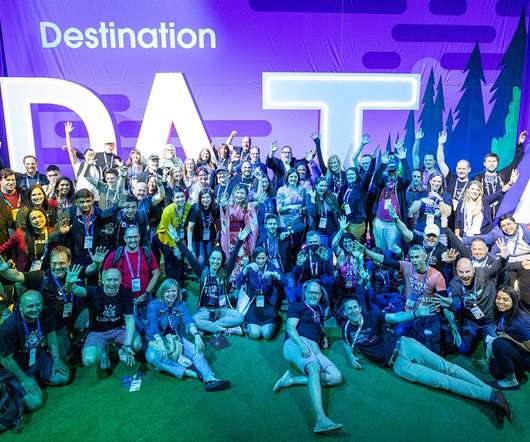
June 2, 2022 - 7:53pm. June 4, 2022. Tableau Conference 2022 was unmistakably the latter, as summed up by Sarah Bartlett , one of the many data lovers who attended TC22 in Las Vegas last month. . CJ Mayes produced a visually stunning piece on the misconceptions around African literacy rates and global health.
March 9, 2022 - 8:03pm. March 15, 2022. Welcome to Best of Tableau Web—a monthly highlight of tips, tricks, and inspiration from across the internet on Tableau and data visualization. DuBois’s data visualization legacy, has yielded some incredible work. DataPlusMusic 2022 | 02 | MIDI Music Analysis. Visualizations.
between 2022 and 2030. Some of their solutions include: big data functionality capable of processing national and state-district level statistics, AI algorithms to formulate automatic solutions, combining data analytics tools with data visualization to show hidden and profound insights to business managers. In 2017, 77% of U.S.
billion by 2022. In AI it refers to computer intelligence, while in BI it is about smart decision-making in business influenced by data analysis and visualization. where data is visualized in multiple easy-to-understand graphs and reports. The market for affiliate marketing is expected to reach $8.2 Business Intelligence.
March 9, 2022 - 8:03pm. March 15, 2022. Welcome to Best of Tableau Web—a monthly highlight of tips, tricks, and inspiration from across the internet on Tableau and data visualization. DuBois’s data visualization legacy, has yielded some incredible work. DataPlusMusic 2022 | 02 | MIDI Music Analysis. Visualizations.
August 5, 2022 - 10:29pm. August 6, 2022. Similar to the advancements in telescope technology, data visualizations 10 years ago were no where near the art they’ve become today. Consider every day things like television and print media—more data visualizations are seeping into the mainstream. Visualizations.
In 2016 experts projected that the “ big data ” industry would be worth somewhere around $30 billion by 2022. In addition to its user-friendliness, Splunk is also touted for its ability to create visual representations of data (graphs, etc.) It does have its own query language, but it’s well-explained and easy to learn.
April 20, 2022 - 5:52pm. April 21, 2022. Here are our staff recommendations for must-see sessions at Tableau Conference 2022, broken out by themes (more on this below) and format (in person or virtual). . Session: Harmonize, Visualize, and Automate Your Data across Tableau and Salesforce. Christine Zuniga.
January 28, 2022 - 3:58pm. January 28, 2022. Through extensive research and data collection across multiple public sources, along with knowledge and guidance from local DC Council Committee staff and coalition partners, primary data was compiled for analysis and visualization. Channing Nesbitt. Kristin Adderson.
January 28, 2022 - 3:58pm. January 28, 2022. Through extensive research and data collection across multiple public sources, along with knowledge and guidance from local DC Council Committee staff and coalition partners, primary data was compiled for analysis and visualization. Channing Nesbitt. Kristin Adderson.
June 2, 2022 - 7:53pm. June 4, 2022. Tableau Conference 2022 was unmistakably the latter, as summed up by Sarah Bartlett , one of the many data lovers who attended TC22 in Las Vegas last month. . CJ Mayes produced a visually stunning piece on the misconceptions around African literacy rates and global health.
April 1, 2022 - 9:47pm. April 5, 2022. The View Behind the Curtain: My Experience as a 2022 Iron Viz Judge. 2022 Week 12 - Solution. Reference Lines And Other Helpful Month Over Month Visuals. Visualizations. Andy Cotgreave. Technical Evangelist Director, Tableau. Bronwen Boyd. Christina Poulin Gorga.
April 1, 2022 - 9:47pm. April 5, 2022. The View Behind the Curtain: My Experience as a 2022 Iron Viz Judge. 2022 Week 12 - Solution. Reference Lines And Other Helpful Month Over Month Visuals. Visualizations. Andy Cotgreave. Technical Evangelist Director, Tableau. Bronwen Boyd. Christina Poulin Gorga.
August 5, 2022 - 10:29pm. August 6, 2022. Similar to the advancements in telescope technology, data visualizations 10 years ago were no where near the art they’ve become today. Consider every day things like television and print media—more data visualizations are seeping into the mainstream. Visualizations.
February 3, 2022 - 7:29pm. February 4, 2022. I had the opportunity to work with Tableau solution engineers to develop visualizations for eight different NGBs representing Team USA at the Olympic Winter Games Beijing 2022. Our team built more than a dozen visualizations to help our NGB partners. Katherine Rowe.
Below you’ll find tech tools that will help you master skills like visual project management, asynchronous communication, presentation creation, and so much more. The post 7 skills every digital project manager should master in 2022 appeared first on monday.com Blog. See our picks for the 7 must-have project management skills below.
May 5, 2022 - 9:53pm. May 7, 2022. The Feedback Loop was a small group discussion framed around building visualizations and going through two feedback rounds, intentionally structured to improve how we give feedback. Tableau Conference Attendee Guide 2022 #data22. Visualizations. Mark Bradbourne. Bronwen Boyd.
May 5, 2022 - 9:53pm. May 7, 2022. The Feedback Loop was a small group discussion framed around building visualizations and going through two feedback rounds, intentionally structured to improve how we give feedback. Tableau Conference Attendee Guide 2022 #data22. Visualizations. Mark Bradbourne. Bronwen Boyd.
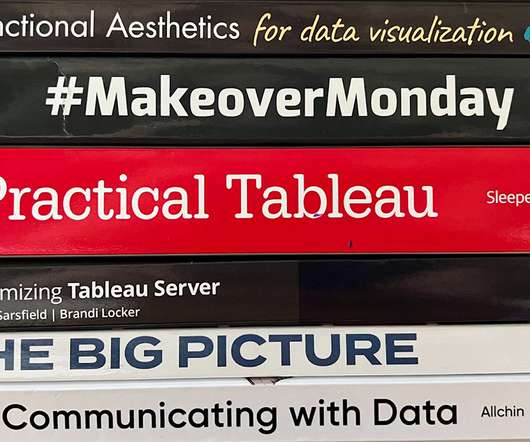
September 30, 2022 - 8:07pm. October 1, 2022. I just received the newest DataFam title, Functional Aesthetics for Data Visualization , authored by Vidya Setlur and Bridget Cogley. Functional Aesthetics goes far beyond charts to look at how we can make our visuals more effective and impactful. Visualizations.
September 30, 2022 - 8:07pm. October 1, 2022. I just received the newest DataFam title, Functional Aesthetics for Data Visualization , authored by Vidya Setlur and Bridget Cogley. Functional Aesthetics goes far beyond charts to look at how we can make our visuals more effective and impactful. Visualizations.
June 8, 2022 - 9:06pm. June 28, 2022. Nominations and applications for the 2022 Tableau Ambassador Program are now open. You can find them answering questions in our forums, publishing content on social platforms, leading or speaking at user groups, contributing code on Github, and teaching people about data visualization.
February 3, 2022 - 10:19pm. February 5, 2022. Reasons to Enter Iron Viz 2022. Visualizations. Mark Bradbourne. National Solutions Engineer, Tableau . Bronwen Boyd. From this project, I saw a really great post from Darragh Murray about the importance of exploratory data analysis. Lindsay Betzendahl , Viz Zen Data.
February 3, 2022 - 10:19pm. February 5, 2022. Reasons to Enter Iron Viz 2022. Visualizations. Mark Bradbourne. National Solutions Engineer, Tableau . Bronwen Boyd. From this project, I saw a really great post from Darragh Murray about the importance of exploratory data analysis. Lindsay Betzendahl , Viz Zen Data.
According to BLS, web developer employment is expected to rise by 16% between 2022 and 2032. Still, the competition is fierce as top companies always seek the best talents who can combine creative and technical skills to craft visuall. This rate outpaces the average job growth rate for other professions. Read More.
While we are at it, Gartner’s 2022 report on business composability further pushes the need for analytics. Financial visualization in key areas can fuel analytical decision-making. At the same time, if the spending exceeds the expected limit, CIOs have to identify weak links and rewrite the quarterly plan. .
January 26, 2022 - 6:31pm. January 27, 2022. According to the National Institutes of Health (NIH), “Data visualization is becoming an increasingly common method of presenting large and complex data sets, but the principles of visual communication are not widely understood or practiced.” Bronwen Boyd.
September 1, 2022 - 6:50pm. September 7, 2022. The Iron Viz finalist and fellow Aussie has been in the Tableau Community for a few years, yet only just recently started the She Will Viz blog focused on raising women’s voices in data visualization. Visualizations. Caroline Yam. Community Manager, Tableau. Bronwen Boyd.
September 1, 2022 - 6:50pm. September 7, 2022. The Iron Viz finalist and fellow Aussie has been in the Tableau Community for a few years, yet only just recently started the She Will Viz blog focused on raising women’s voices in data visualization. Visualizations. Caroline Yam. Community Manager, Tableau. Bronwen Boyd.
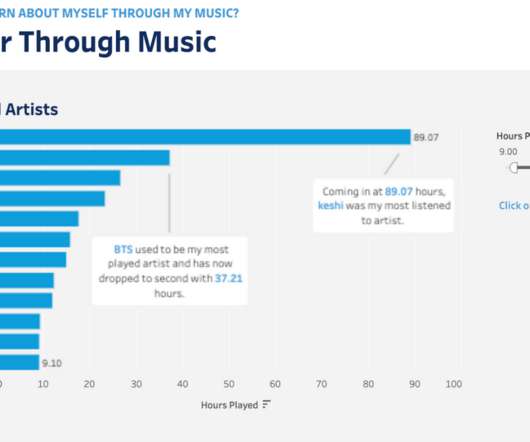
November 17, 2022 - 1:43am. November 19, 2022. Whether this is your first Tableau visualization or your 100th, let this be a chance to practice and grow your viz-building skills using your own personal data! A visual representation of one or more rows in a data source. Anezi Bueno. Marketing Associate Analyst.
February 3, 2022 - 7:29pm. February 4, 2022. I had the opportunity to work with Tableau solution engineers to develop visualizations for eight different NGBs representing Team USA at the Olympic Winter Games Beijing 2022. Our team built more than a dozen visualizations to help our NGB partners. Katherine Rowe.
There are a lot of benefits of using artificial intelligence in 2022. “In the recent past, we have come across AI-enabled smart cameras that can click the right picture and even identify the people in the visuals. One of the biggest reasons that many people use AI is to improve their marketing strategies. Simple is Smart.
January 26, 2022 - 6:31pm. January 27, 2022. According to the National Institutes of Health (NIH), “Data visualization is becoming an increasingly common method of presenting large and complex data sets, but the principles of visual communication are not widely understood or practiced.” Bronwen Boyd.
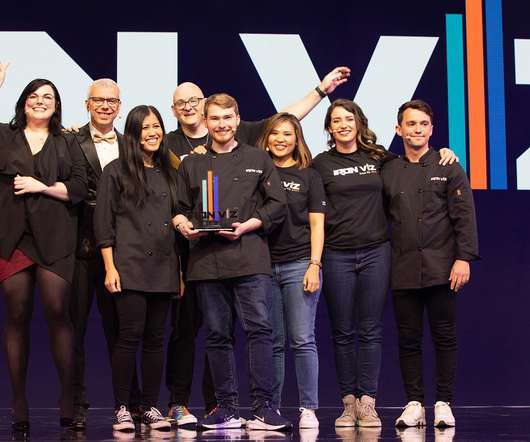
May 18, 2022 - 8:46pm. May 18, 2022. The Iron Viz contenders had 20 nail-biting minutes to build an awe-inspiring visualization that would energize and electrify a panel of three viz-savvy judges and a massive live audience of data enthusiasts from across the globe. This officially ends Iron Viz 2022. Alyssa Jenson.
We organize all of the trending information in your field so you don't have to. Join 57,000+ users and stay up to date on the latest articles your peers are reading.
You know about us, now we want to get to know you!
Let's personalize your content
Let's get even more personalized
We recognize your account from another site in our network, please click 'Send Email' below to continue with verifying your account and setting a password.


Let's personalize your content