This site uses cookies to improve your experience. To help us insure we adhere to various privacy regulations, please select your country/region of residence. If you do not select a country, we will assume you are from the United States. Select your Cookie Settings or view our Privacy Policy and Terms of Use.
Cookie Settings
Cookies and similar technologies are used on this website for proper function of the website, for tracking performance analytics and for marketing purposes. We and some of our third-party providers may use cookie data for various purposes. Please review the cookie settings below and choose your preference.
Used for the proper function of the website
Used for monitoring website traffic and interactions
Cookie Settings
Cookies and similar technologies are used on this website for proper function of the website, for tracking performance analytics and for marketing purposes. We and some of our third-party providers may use cookie data for various purposes. Please review the cookie settings below and choose your preference.
Strictly Necessary: Used for the proper function of the website
Performance/Analytics: Used for monitoring website traffic and interactions
Key components of Big Dataanalytics [own elaboration] Big Dataanalytics refers to advanced techniques used to analyze massive, diverse, and complex data sets. At its core, Big DataAnalytics seeks to uncover patterns, correlations, and trends that traditional methods mightmiss.
In the early days of analytics, only the largest companies could afford to leverage big data. But which tools are the most effective for businesses in 2021? Here’s more on why data is so important for companies and the top 5 analytics tools they’re using this year to stay ahead of the curve and their competition.
Previously, we discussed the top 19 big data books you need to read, followed by our rundown of the world’s top business intelligence books as well as our list of the best SQL books for beginners and intermediates. Datavisualization, or ‘data viz’ as it’s commonly known, is the graphic presentation of data.
Data analysts are in high demand: From technology giants like IBM and Microsoft to our favorite media streaming providers like Netflix and Amazon Prime, organizations are increasingly relying on dataanalytics to make smart business decisions. […].
This year, embrace the spirit of spring at the TIBCO Analytics Forum (TAF) 2021 by learning about new analytics and data management technologies and approaches and how to foster growth in the coming years. So much compelling content awaits you at TAF 2021. So much compelling content awaits you at TAF 2021.
The DataAnalytics Lifecycle is a diagram that depicts these steps for professionals that are involved in dataanalytics projects. The phases of the DataAnalytics Lifecycle are organized in a circular framework, which is referred to as the DataAnalytics Lifecycle. Click below to know more.
Last week one of my LinkedIn connections asked for my views on this subject and I suddenly remembered my situation back in 2021. Out of fear and stress, I started learning SQL, Python, DataAnalytics and whatnot. I lost track of everything in between, except the DataAnalytics part. I never liked it.
Phocas dataanalytics is excited to be recognized as one of the most valuable business tools of 2020 by GetApp, a Gartner digital markets review website. The role of technology and ongoing digitalization remains critical to business success in 2021 as companies rely more on online orders and accurate data to gauge performance.
October 8, 2021 - 11:41pm. October 12, 2021. It's more important than ever in this all digital, work from anywhere world for organizations to use data to make informed decisions. However, most organizations struggle to become data driven. Francois Ajenstat. Chief Product Officer, Tableau. Spencer Czapiewski.
Health care organizations across the world are in varying stages of maturity when it comes to data and working with their data assets. Sure, they all store and manage their data in some way, but in 2021, I hope forward-thinking organizations are addressing the key questions. What’s […].
June 8, 2021 - 11:20pm. June 9, 2021. Can you picture a world where data storytelling does no harm? The Tableau Foundation has collaborated with The Urban Institute to bring to you the Do No Harm Guide : Applying Equity Awareness in DataVisualization. SENIOR DATA SCIENTIST, NATERA. Kristin Adderson.
Capacity Building Analytics Manager, Feeding America. Analytics Manager, Feeding America. May 17, 2021 - 3:42pm. May 17, 2021. To fulfill this work, we needed data, and we needed a lot of it, fast. Lauren Lapinski. Kristin Adderson. In 2019, 35 million people —10.9% of the US population—experienced food insecurity.
This genie (who we’ll call Data Dan) embodies the idea of a perfect dataanalytics platform through his magic powers. Now, with Data Dan, you only get to ask him three questions. The questions to ask when analyzing data will be the framework, the lens, that allows you to focus on specific aspects of your business reality.
To understand how to get there, let’s first look at why it’s been so complicated to leverage all your data. Your company likely has data integrations and pipelines in place to support using dataanalytics to answer business questions, discover relationships and correlations, and predict outcomes across key areas of your business.
With ‘big data’ transcending one of the biggest business intelligence buzzwords of recent years to a living, breathing driver of sustainable success in a competitive digital age, it might be time to jump on the statistical bandwagon, so to speak. of all data is currently analyzed and used. click for book source**.
October 8, 2021 - 11:41pm. October 12, 2021. It's more important than ever in this all digital, work from anywhere world for organizations to use data to make informed decisions. However, most organizations struggle to become data driven. Francois Ajenstat. Chief Product Officer, Tableau. Spencer Czapiewski.
Microsoft also releases Power BI, a datavisualization and business intelligence tool. Arc is a disruptive solution for hybrid cloud strategy which lets users run Azure data services on multi-cloud, on-premises, and edge. 2021: The global cloud market size is at USD $445.3 Expected to reach USD $947.3 To be continued.
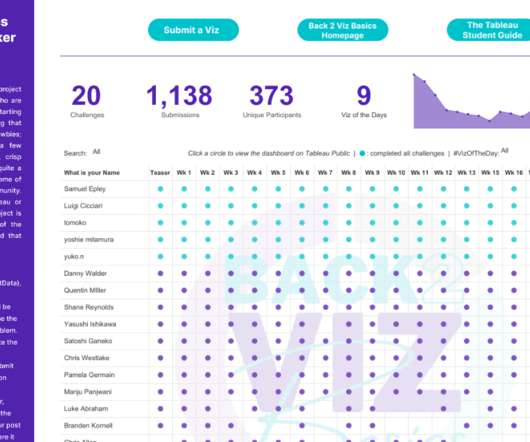
If you’re looking for a fun way to connect with data enthusiasts while also reinforcing foundational datavisualization skills, Back to Viz Basics (B2VB)—a Tableau Community Project—is the perfect place to start. Eric Balash (@ReadySetData) November 4, 2021. Alyssa Jenson. September 30, 2022 - 7:59pm. October 2, 2022.
If you’re looking for a fun way to connect with data enthusiasts while also reinforcing foundational datavisualization skills, Back to Viz Basics (B2VB)—a Tableau Community Project—is the perfect place to start. Eric Balash (@ReadySetData) November 4, 2021. Alyssa Jenson. September 30, 2022 - 7:59pm. October 2, 2022.
If you’re looking for a fun way to connect with data enthusiasts while also reinforcing foundational datavisualization skills, Back to Viz Basics (B2VB)—a Tableau Community Project—is the perfect place to start. Eric Balash (@ReadySetData) November 4, 2021. Alyssa Jenson. September 30, 2022 - 7:59pm. October 2, 2022.
Business leaders, developers, data heads, and tech enthusiasts – it’s time to make some room on your business intelligence bookshelf because once again, datapine has new books for you to add. We have already given you our top datavisualization books , top business intelligence books , and best dataanalytics books.
billion by the end of 2021. Moreover, companies that use BI analytics are five times more likely to make swifter, more informed decisions. Despite these findings, the undeniable value of intelligence for business, and the incredible demand for BI skills, there is a severe shortage of BI-based data professionals – with a shortfall of 1.5
Experience with data warehousing tools, such as MySQL, Cassandra, HDFS, or DB2. Basic understanding of dataanalytics or statistics. Good understanding of data processing technologies, such as Apache Spark, MapReduce, or Hadoop. DataVisualization. The low-code development trend has picked up steam in 2021.
Capacity Building Analytics Manager, Feeding America. Analytics Manager, Feeding America. May 17, 2021 - 3:42pm. May 17, 2021. To fulfill this work, we needed data, and we needed a lot of it, fast. Lauren Lapinski. Kristin Adderson. In 2019, 35 million people —10.9% of the US population—experienced food insecurity.
June 8, 2021 - 11:20pm. June 9, 2021. Can you picture a world where data storytelling does no harm? The Tableau Foundation has collaborated with The Urban Institute to bring to you the Do No Harm Guide : Applying Equity Awareness in DataVisualization. SENIOR DATA SCIENTIST, NATERA. Kristin Adderson.
Ballew is planning to infuse analytics into the NFL’s internal workflows to track metrics like injury rates, new ticketing models, game scheduling, and sponsorship packages based on fan activity. It’s a sign of our commitment to dataanalytics and our view that’s essential in a digital world,” the NFL said regarding hiring Ballew.
Professionals without any background in data or analytics can start learning Tableau easily. Given Tableau’s well-established position in the market for datavisualization, certification of Tableau skills can present a lucrative path to career growth. Tableau Certification Benefits.
July 19, 2021 - 11:09pm. July 20, 2021. Data skills are important for all. Our mission is to lower the barrier of entry to learning analytics and build data literacy skills in future generations. . In partnership with AICTE, we will help equip the future workforce of India with these critical data skills.
July 19, 2021 - 11:09pm. July 20, 2021. Data skills are important for all. Our mission is to lower the barrier of entry to learning analytics and build data literacy skills in future generations. In partnership with AICTE, we will help equip the future workforce of India with these critical data skills.
So we asked some Sisense leaders: Why is there so often a shortfall between companies’ aspirations and the reality of what they’re getting out of their analytics solutions? In fact, within most organizations, there’s a gaping expanse between analytics capabilities and having the skills to use them. Here’s what we found.
The demand for skilled dataanalytics professionals continues to grow, and it is a C-suite priority. According to IDC, 83% of CEOs expect their organizations to be more data-driven. However, people often lack essential data skills with only 33% of employees comfortable using dataanalytics to support their decisions.
The demand for skilled dataanalytics professionals continues to grow, and it is a C-suite priority. According to IDC, 83% of CEOs expect their organizations to be more data-driven. However, people often lack essential data skills with only 33% of employees comfortable using dataanalytics to support their decisions.
The demand for skilled dataanalytics professionals continues to grow, and it is a C-suite priority. According to IDC, 83% of CEOs expect their organizations to be more data-driven. However, people often lack essential data skills with only 33% of employees comfortable using dataanalytics to support their decisions.
This is in contrast to traditional BI, which extracts insight from data outside of the app. According to the 2021 State of Analytics: Why Users Demand Better report by Hanover Research, 77 percent of organizations consider end-user data literacy “very” or “extremely important” in making fast and accurate decisions.
In this year’s survey, 41 percent of finance team leaders considered strategic decision making to be a priority, compared to 29 percent in 2021. The Office of Finance is now firmly seated at the strategy table within organizations, as leadership looks to financial data to inform key strategy questions. Download Now.
We organize all of the trending information in your field so you don't have to. Join 57,000+ users and stay up to date on the latest articles your peers are reading.
You know about us, now we want to get to know you!
Let's personalize your content
Let's get even more personalized
We recognize your account from another site in our network, please click 'Send Email' below to continue with verifying your account and setting a password.


Let's personalize your content