This site uses cookies to improve your experience. To help us insure we adhere to various privacy regulations, please select your country/region of residence. If you do not select a country, we will assume you are from the United States. Select your Cookie Settings or view our Privacy Policy and Terms of Use.
Cookie Settings
Cookies and similar technologies are used on this website for proper function of the website, for tracking performance analytics and for marketing purposes. We and some of our third-party providers may use cookie data for various purposes. Please review the cookie settings below and choose your preference.
Used for the proper function of the website
Used for monitoring website traffic and interactions
Cookie Settings
Cookies and similar technologies are used on this website for proper function of the website, for tracking performance analytics and for marketing purposes. We and some of our third-party providers may use cookie data for various purposes. Please review the cookie settings below and choose your preference.
Strictly Necessary: Used for the proper function of the website
Performance/Analytics: Used for monitoring website traffic and interactions
Big Data is taking center stage, and it is touted as one of the most groundbreaking technologies of the present time. The utilization of Big Data is not only limited to only one sector anymore. Instead, Big Data is used in various different sectors. However, Big Data is used extensively in the corporate world as well.
If your company lacks a big data strategy, then you need to start developing one today. The best thing that you can do is find some dataanalytics tools to solve your most pressing challenges. Using Big Data to Fix Your Biggest Problems as a Business Owner. In 2019, big data technology is paramount in business.
Dataanalytics is the backbone in many modern organizations. Companies need to analyze data to optimize their business models in a variety of ways. They have found that big data has changed their business models in countless ways. DataAnalytics Can Be Invaluable for Creating Dedicated Team Models.
Big dataanalytics has already had a transformative influence across a wide range of sectors, and it’s perhaps no more prevalent than in the world of healthcare. Big dataanalytics has enabled doctors to access a holistic view of a patient’s health history.
Marketers used to make decisions primarily off of conjecture because they didn’t have the detailed analytics capabilities that are available in 2019. In the age of big data, marketers are able to take advantage of much more sophisticated analytics capabilities. In 2019, Pinterest has 250 million active users.
The Data Scientist profession today is often considered to be one of the most promising and lucrative. The Bureau of Labor Statistics estimates that the number of data scientists will increase from 32,700 to 37,700 between 2019 and 2029. Where to Use Data Mining? Data Mining Techniques and DataVisualization.
The difference is that big data technology has made email more powerful than ever. If you want to make the most of this interactive channel, you must use dataanalytics to: Review it with a new coat of paint. Create UX-centric visuals and designs. Look at it from a creative angle. Include clickable buttons.
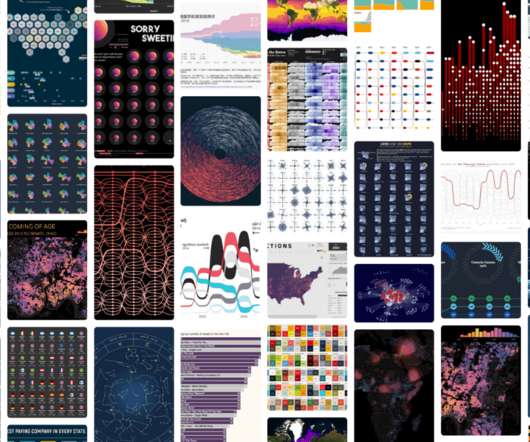
Previously, we discussed the top 19 big data books you need to read, followed by our rundown of the world’s top business intelligence books as well as our list of the best SQL books for beginners and intermediates. Datavisualization, or ‘data viz’ as it’s commonly known, is the graphic presentation of data.
Combined, it has come to a point where dataanalytics is your safety net first, and business driver second. By 2025, 80% of organizations seeking to scale digital business will fail because they do not take a modern approach to data and analytics governance. Uncertain economic conditions. Source: Gartner Research).
Ludwig is a tool that allows people to build data-based deep learning models to make predictions. Ludwig is a TensorFlow-based toolbox that aims to allow people to use machine learning during their data work without having extensive prior knowledge. .” It allows secure and interactive SQL analytics at the petabyte scale.
2019 can best be described as an era of modern cloud dataanalytics. Convergence in an industry like dataanalytics can take many forms. We have seen industry rollups in which firms create a collection of analytical tools under one brand. The truth always rises to the surface.
Data skills are in high demand. Jobs requiring digital skills, particularly dataanalytics and visualization, will grow by 10% in the next five years, jumping from 27% to 37%, according to a new IDC Salesforce Economy study. Only 33% of employees are comfortable using dataanalytics to support their decisions.
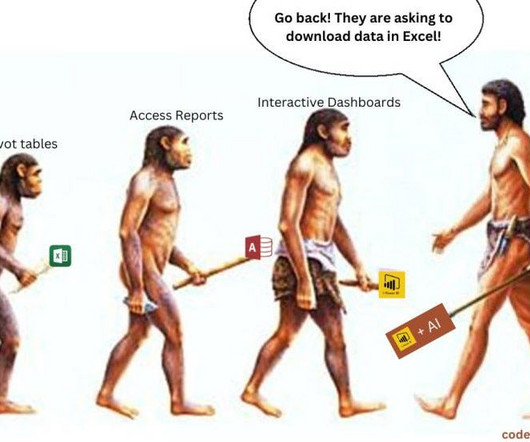
Why learning Excel is important for a career working with data Image used with permission from Hemanand Vadivel, Co-founder codebasics.io This article was first published in The Data Pub Newsletter on Substack on January 5, 2023. She is also publisher of “The Data Pub” newsletter on Substack. 3, 2023, I get 45.2 million results.
With the expanding pace of digital changes in business, most analysts are increasingly asking, “What more can we do with data to assist business decisions?” ” Thankfully, there is predictive analytics. Adopting dataanalytics solutions is a significant milestone in the development and success of any business.
Data skills are in high demand. Jobs requiring digital skills, particularly dataanalytics and visualization, will grow by 10% in the next five years, jumping from 27% to 37%, according to a new IDC Salesforce Economy study. Only 33% of employees are comfortable using dataanalytics to support their decisions.
Capacity Building Analytics Manager, Feeding America. Analytics Manager, Feeding America. In 2019, 35 million people —10.9% Our data has shown, year over year, that people of color in the US are disproportionately likely to face difficulty in accessing adequate and healthy food for their families. . Lauren Lapinski.
Can you picture a world where data storytelling does no harm? The Tableau Foundation has collaborated with The Urban Institute to bring to you the Do No Harm Guide : Applying Equity Awareness in DataVisualization. It addresses the responsibility we all share in using data ethically to advance equity in our society.
The data helps her make nuanced adjustments to her stroke, such as kicking harder, or kicking harder with her opposite leg. The Paralympic Games classification system is built on comprehensive dataanalytics about the athletes, and is foundational to the entire Paralympic Movement. Signature event: 100m Butterfly.
The data helps her make nuanced adjustments to her stroke, such as kicking harder, or kicking harder with her opposite leg. The Paralympic Games classification system is built on comprehensive dataanalytics about the athletes, and is foundational to the entire Paralympic Movement. Signature event: 100m Butterfly.
For more on what to expect, check out the highlights from TAF 2019 on the TAF community homepage. And get a head start on upping your analytics knowledge by exploring the TIBCO Community Blog and Spotfire demo gallery.
This is infused analytics at work: Wearable devices deliver data and insights directly to the coaches, enabling them to make decisions and transform teams’ performance without technical data expertise. These developments have added a whole new dimension to data analysis. Example of Sisense player performance dashboard.
Since the program’s start in 2019, the Tableau for Students team has supported more than 200 students around the globe—evangelizing Tableau and nurturing the data rockstars of tomorrow. Create datavisualization tips and tricks geared toward students and new learners.
2019 was a breakthrough year for the SaaS world in many ways. Indeed, according to Bloomberg, public cloud platforms, business services, and applications (SaaS) will all grow at a 9% CAGR (Compound Annual Growth Rate) between 2019 and 2023, and worth $60.36 A Betterbuys report reveals that the specific expenditure in the U.S.
Microsoft also releases Power BI, a datavisualization and business intelligence tool. Edge computing is the process of decentralizing computer services and shifting them closer to the data source. 2019: Hybrid cloud strategy starts to trend. He puts forth a mobile-first, cloud-first strategy. Google announces Cloud IoT.
Data Literacy Fundamentals” (2:45 – 6 p.m.) * Data literacy is a crucial component to succeeding in dataanalytics. Customize your card using the wide breadth of chart properties available, and learn the basics of calculated fields to create ad-hoc data transformations on your visualization.
Capacity Building Analytics Manager, Feeding America. Analytics Manager, Feeding America. In 2019, 35 million people —10.9% Our data has shown, year over year, that people of color in the US are disproportionately likely to face difficulty in accessing adequate and healthy food for their families. . Lauren Lapinski.
Most companies today are set up with data teams or a group of data specialists that are dedicated to driving informed business decisions from the organization’s data. Imagine a colorful, visual graph that is very unique, very personal, and very full of relevant information. Value for the entire company.
We hosted over 150 people from more than 100 companies, who gathered to learn why data can supercharge their companies and how harnessing the huge power of data can take business from startup to unicorn. It’s why Sisense, having merged with Periscope Data in May 2019, chose to host this event in Tel Aviv.
Can you picture a world where data storytelling does no harm? The Tableau Foundation has collaborated with The Urban Institute to bring to you the Do No Harm Guide : Applying Equity Awareness in DataVisualization. It addresses the responsibility we all share in using data ethically to advance equity in our society.
Ballew is planning to infuse analytics into the NFL’s internal workflows to track metrics like injury rates, new ticketing models, game scheduling, and sponsorship packages based on fan activity. It’s a sign of our commitment to dataanalytics and our view that’s essential in a digital world,” the NFL said regarding hiring Ballew.
The engineering team he leads is responsible for building and maintaining Microsoft Azure, Dynamics 365, Windows/Windows Server, HoloLens, Visual Studio/Visual Studio Code, GitHub, SQL Server, and Power BI. . George Anadiotis – Founder, Researcher, Writer at Linked Data Orchestration, Analyst, Consultant, Engineer, Journalist.
By analyzing data to gain insights into student behavior and performance, educators can create personalized teaching methods and enhance student engagement. According to a report by MarketsandMarkets, the global learning analytics market is expected to reach US$8.2 during 2019-2024.
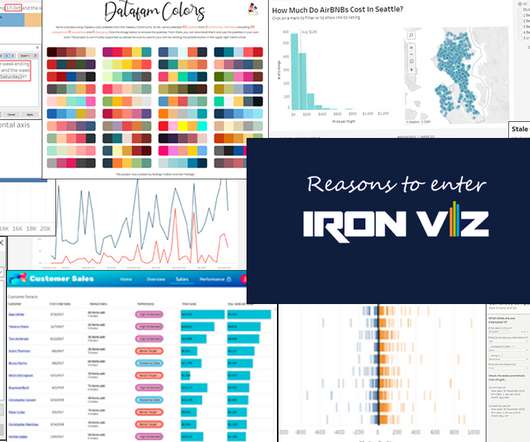
You’re building a bigger Tableau portfolio, too, which is great for a career in dataanalytics. In blogs this month, past winners shared their ideas, including Joshua Smith (2019 co-champion) and Sarah Bartlett (2018 finalist). Beth Kairys, InterWorks : Date Comparisons in Tableau, Part 2: Visualization.
yr – $185K/yr Full-time About the job Description Amazons Global Risk Management & Claims team is seeking a highly skilled and detail-oriented Business Analyst with a robust background in economic theory, auto claims management, and dataanalytics. Strong knowledge of datavisualization tools (e.g.,
Ordinal data variables have a natural ordering, but the distance between the categories is not known like education level, your mood (Very happy, happy, bored, sad, very sad), grades received (70 and above, 60 -70, 50- 60, 40-50, below 40) and so on. We can compare data across 2015 to 2019 for different terminals.
You’re building a bigger Tableau portfolio, too, which is great for a career in dataanalytics. In blogs this month, past winners shared their ideas, including Joshua Smith (2019 co-champion) and Sarah Bartlett (2018 finalist). Beth Kairys, InterWorks : Date Comparisons in Tableau, Part 2: Visualization.
Big data has changed the way we manage, analyze, and leverage data across industries. One of the most notable areas where dataanalytics is making big changes is healthcare. The application of big dataanalytics in healthcare has a lot of positive and also life-saving outcomes. 3) Real-Time Alerting.
Smarten, an advanced analytics service provider, has announced that it will act as a Silver Sponsor for the Gartner Data & Analytics Summit 2019, June 10 through June 11 in Mumbai, India where it will demonstrate its Smarten Advanced Analytics solution and its product roadmap for the future of the Smarten Augmented Analytics product suite.
Smarten, an advanced analytics service provider, has announced that it will act as a Silver Sponsor for the Gartner Data & Analytics Summit 2019, June 10 through June 11 in Mumbai, India where it will demonstrate its Smarten Advanced Analytics solution and its product roadmap for the future of the Smarten Augmented Analytics product suite.
Smarten, an advanced analytics service provider, has announced that it will act as a Silver Sponsor for the Gartner Data & Analytics Summit 2019, June 10 through June 11 in Mumbai, India where it will demonstrate its Smarten Advanced Analytics solution and its product roadmap for the future of the Smarten Augmented Analytics product suite.
ElegantJ BI is pleased to announce that it will participate in The Vibrant Gujarat Global Summit 2019, where it will engage with partners and clients and demonstrate its Smarten product and innovative approach to advanced analytics. “We are pleased to participate in the 9th Vibrant Gujarat Global Summit,” says Patel.
ElegantJ BI is pleased to announce that it will participate in The Vibrant Gujarat Global Summit 2019, where it will engage with partners and clients and demonstrate its Smarten product and innovative approach to advanced analytics. “We are pleased to participate in the 9th Vibrant Gujarat Global Summit,” says Patel.
ElegantJ BI is pleased to announce that it will participate in The Vibrant Gujarat Global Summit 2019, where it will engage with partners and clients and demonstrate its Smarten product and innovative approach to advanced analytics. “We are pleased to participate in the 9th Vibrant Gujarat Global Summit,” says Patel.
Spreadsheets finally took a backseat to actionable and insightful datavisualizations and interactive business dashboards. The rise of self-service analytics democratized the data product chain. Suddenly advanced analytics wasn’t just for the analysts. 2) Data Discovery/Visualization.
We organize all of the trending information in your field so you don't have to. Join 57,000+ users and stay up to date on the latest articles your peers are reading.
You know about us, now we want to get to know you!
Let's personalize your content
Let's get even more personalized
We recognize your account from another site in our network, please click 'Send Email' below to continue with verifying your account and setting a password.


Let's personalize your content