This site uses cookies to improve your experience. To help us insure we adhere to various privacy regulations, please select your country/region of residence. If you do not select a country, we will assume you are from the United States. Select your Cookie Settings or view our Privacy Policy and Terms of Use.
Cookie Settings
Cookies and similar technologies are used on this website for proper function of the website, for tracking performance analytics and for marketing purposes. We and some of our third-party providers may use cookie data for various purposes. Please review the cookie settings below and choose your preference.
Used for the proper function of the website
Used for monitoring website traffic and interactions
Cookie Settings
Cookies and similar technologies are used on this website for proper function of the website, for tracking performance analytics and for marketing purposes. We and some of our third-party providers may use cookie data for various purposes. Please review the cookie settings below and choose your preference.
Strictly Necessary: Used for the proper function of the website
Performance/Analytics: Used for monitoring website traffic and interactions
ElegantJ BI announces its participation in The Vibrant Gujarat StartUp & Technology Summit 2018, October 11 through October 13 at the Helipad Exhibition Centre in Gandhinagar, Gujarat, India. Clients, partners and technology innovators are invited to visit Stall No 36, in Hall #1 to experience the Smarten approach to advanced analytics.
ElegantJ BI announces its participation in The Vibrant Gujarat StartUp & Technology Summit 2018, October 11 through October 13 at the Helipad Exhibition Centre in Gandhinagar, Gujarat, India. Clients, partners and technology innovators are invited to visit Stall No 36, in Hall #1 to experience the Smarten approach to advanced analytics.
ElegantJ BI announces its participation in The Vibrant Gujarat StartUp & Technology Summit 2018, October 11 through October 13 at the Helipad Exhibition Centre in Gandhinagar, Gujarat, India. Clients, partners and technology innovators are invited to visit Stall No 36, in Hall #1 to experience the Smarten approach to advanced analytics.
In 2018, Blake Morgan wrote an article in Forbes detailing how Amazon rebranded itself around AI. AI helps companies create higher quality visuals for their ads. Therefore, it is no surprise that the market for AI-enabled ecommerce services is projected to be worth nearly $17 billion by 2030. Increase Views With Google.
From invisible UI to emotional personalisation to biometric authentication, which UI trends will be rocking our experts’ socks off in 2018? So over the last couple of weeks we asked some of the most respected UX professionals the following question… What do you think will be the biggest UI trend in 2018? Look, we get it.
These AI algorithms understand users’ inputs to create visually stunning designs based on those preferences and needs. To put that in perspective, at the end of 2018, there were 2.5 Companies such as Tailor Brands are using AI to create branding and logo design assets for small businesses. Voice recognition.
Healthy options are always appreciated and I would encourage the Gartner team to add to the choices for the 2018 Summit. We had a great response, especially with our Smarten Advanced Data Discovery with self serve data prep, smart visualization and plug n’ play predictive analytics. I want to thank those who visited our booth.
Healthy options are always appreciated and I would encourage the Gartner team to add to the choices for the 2018 Summit. We had a great response, especially with our Smarten Advanced Data Discovery with self serve data prep, smart visualization and plug n’ play predictive analytics. I want to thank those who visited our booth.
Healthy options are always appreciated and I would encourage the Gartner team to add to the choices for the 2018 Summit. We had a great response, especially with our Smarten Advanced Data Discovery with self serve data prep, smart visualization and plug n’ play predictive analytics. I want to thank those who visited our booth.
History and innovations in recent times. Cloud technology and innovation drives data-driven decision making culture in any organization. It is the epitome of modern technology right now with multi-dimensional innovations shaping every layer. The pandemic gave it the push it needed to accelerate in terms of growth and innovation.
Exciting and futuristic, the concept of computer vision is based on computing devices or programs gaining the ability to extract detailed information from visual images. Visual analytics: Around three million images are uploaded to social media every single day. Artificial Intelligence (AI). Take Walt Disney World, for instance.
Our innovations are people-centric by design, helping unlock creativity to solve tangible challenges with data. Tableau lets you visualize and explore all of your data without having to write code or premeditate your vizzes and dashboards. People love Tableau because it’s powerful, yet intuitive.
Some of his must read write-ups are 5 Pillars of Innovation , The 20/20 Vision of Cloud , and Making Smart Cloud Choices in Uncertain Times. He has hit 3000 blog posts for the AWS blog in 2018. Prof Bill Buchanan – Professor at Edinburgh Napier University, Officer of the Order of the British Empire (OBE), A Serial Innovator.
Bringing the Narrative Science award-winning, world-leading AI in analytics team and their innovations to Tableau will help us reach millions more people who are underserved with data," said Tableau President and CEO Mark Nelson. Put analytics in the flow of work. and/or its affiliates in the U.S.
Bringing the Narrative Science award-winning, world-leading AI in analytics team and their innovations to Tableau will help us reach millions more people who are underserved with data," said Tableau President and CEO Mark Nelson. Put analytics in the flow of work. and/or its affiliates in the U.S.
Whether covering data science, big data, online data visualization , or data analytics, publications centered on BI and dashboard design are piling up in bookstores around the globe. Big data encompasses a significant portion of the BI pie, and this 2018 offering from David Stephenson Ph.D. click for book source**.
In Spring 2018, Cprime set out to reimagine its entire brand —its mission statement, company vision, unique selling proposition, even our color palette, typography, and photography—to reposition the company. Iconography is a set of symbols or icons used to visually communicate a message or add visual support to a multitude of assets.
We have already given you our top data visualization books , top business intelligence books , and best data analytics books. Originally published in 2018, the book has a second edition that was released in January of 2022. Now it’s time to ponder over our hand-picked list of the 20 best SQL learning books available today.
Our innovations are people-centric by design, helping unlock creativity to solve tangible challenges with data. Tableau lets you visualize and explore all of your data without having to write code or premeditate your vizzes and dashboards. People love Tableau because it’s powerful, yet intuitive.
The start of a new decade presents a fresh incentive for CMOs to reform and innovate their marketing processes. As General Electric’s CIO, Sue Siegel, said in a keynote address in 2018: “The pace of change will never be as slow as it is today.” ” In marketing especially, the pace of change has become unrelenting.
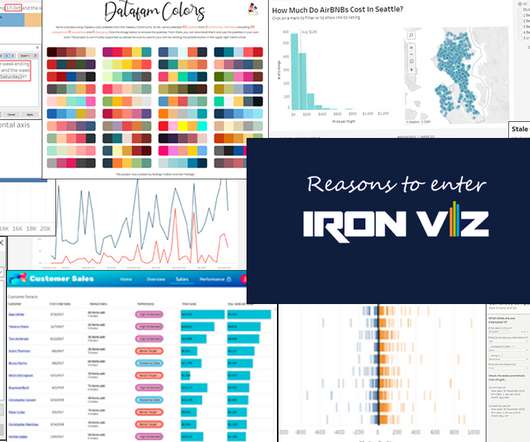
In blogs this month, past winners shared their ideas, including Joshua Smith (2019 co-champion) and Sarah Bartlett (2018 finalist). Maggy Muellner, Playfair Data : 3 Innovative Ways to Use Filters in Tableau. Beth Kairys, InterWorks : Date Comparisons in Tableau, Part 2: Visualization. You must also read Priyank Dobahl’s post.
In blogs this month, past winners shared their ideas, including Joshua Smith (2019 co-champion) and Sarah Bartlett (2018 finalist). Maggy Muellner, Playfair Data : 3 Innovative Ways to Use Filters in Tableau. Beth Kairys, InterWorks : Date Comparisons in Tableau, Part 2: Visualization. You must also read Priyank Dobahl’s post.
Innovation is necessary to use data effectively in the pursuit of a better world, particularly because data continues to increase in size and richness. I am proud to announce that my History of Tableau Innovation viz is now published to Tableau Public. Click to view the full interactive visualization. December 1, 2021 - 11:06pm.
Innovation is necessary to use data effectively in the pursuit of a better world, particularly because data continues to increase in size and richness. I am proud to announce that my History of Tableau Innovation viz is now published to Tableau Public. Click to view the full interactive visualization. December 1, 2021 - 11:06pm.
These product innovations provide the foundation for exciting, new, easy-to-use features and self-serve, deep dive functionality that free IT and data scientists to focus on strategic issues, while ensuring an integrated, collaborative view of metrics, activities and tasks that enable business success.”
These product innovations provide the foundation for exciting, new, easy-to-use features and self-serve, deep dive functionality that free IT and data scientists to focus on strategic issues, while ensuring an integrated, collaborative view of metrics, activities and tasks that enable business success.”
These product innovations provide the foundation for exciting, new, easy-to-use features and self-serve, deep dive functionality that free IT and data scientists to focus on strategic issues, while ensuring an integrated, collaborative view of metrics, activities and tasks that enable business success.” About Smarten.
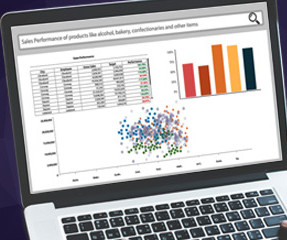
Summing up the product of all this work, the data science team developed a web-based user interface that forecasts patient loads and helps in planning resource allocation by utilizing online data visualization that reaches the goal of improving the overall patients’ care. 18) Developing New Therapies & Innovations.
ElegantJ BI, an innovative vendor in Business Intelligence, Augmented Analytics and Augmented Data Preparation, is pleased to announce its participation in the Gartner 2018 INDIA Data & Analytics Summit from 5 – 6th June 2018 in Mumbai, India. ElegantJ BI is proud to be a Silver Sponsor at this important event.
ElegantJ BI, an innovative vendor in Business Intelligence, Augmented Analytics and Augmented Data Preparation, is pleased to announce its participation in the Gartner 2018 INDIA Data & Analytics Summit from 5 – 6th June 2018 in Mumbai, India. ElegantJ BI is proud to be a Silver Sponsor at this important event.
ElegantJ BI, an innovative vendor in Business Intelligence, Augmented Analytics and Augmented Data Preparation, is pleased to announce its participation in the Gartner 2018 INDIA Data & Analytics Summit from 5 – 6th June 2018 in Mumbai, India. ElegantJ BI is proud to be a Silver Sponsor at this important event.
Augmented Analytics includes Assisted Predictive Modeling, Smart Data Visualization, Self-Serve Data Preparation, Clickless Analytics, NLP Search Analytics, Automated Machine Learning (AutoML), which enables faster, or accurate analysis across the organization, optimizes resources and improves the value of each team member.
Augmented Analytics includes Assisted Predictive Modeling, Smart Data Visualization, Self-Serve Data Preparation, Clickless Analytics, NLP Search Analytics, Automated Machine Learning (AutoML), which enables faster, or accurate analysis across the organization, optimizes resources and improves the value of each team member.
Augmented Analytics includes Assisted Predictive Modeling, Smart Data Visualization, Self-Serve Data Preparation, Clickless Analytics, NLP Search Analytics, Automated Machine Learning (AutoML), which enables faster, or accurate analysis across the organization, optimizes resources and improves the value of each team member.
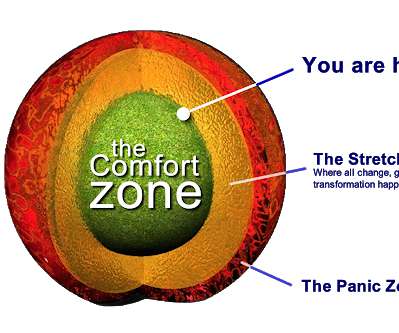
Here’s my first week of running, March 2018: Yep: 30 mins to cover 1.75 However, in the comfort zone, there is also little growth, change, innovation, or creativity. Frank encouraged me to sign up for the November 2018 Bucks County Half Marathon, which was about 5 months away at the time. This is the land of fixed mindset. .
Here’s my first week of running, March 2018: Yep: 30 mins to cover 1.75 However, in the comfort zone, there is also little growth, change, innovation, or creativity. Frank encouraged me to sign up for the November 2018 Bucks County Half Marathon, which was about 5 months away at the time. This is the land of fixed mindset. .
We organize all of the trending information in your field so you don't have to. Join 57,000+ users and stay up to date on the latest articles your peers are reading.
You know about us, now we want to get to know you!
Let's personalize your content
Let's get even more personalized
We recognize your account from another site in our network, please click 'Send Email' below to continue with verifying your account and setting a password.


Let's personalize your content