Remove 2018 Remove Data Visualization Remove Presentation
article thumbnail

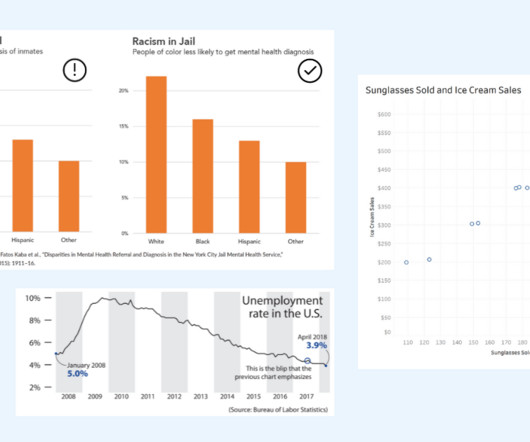
How to Spot Misleading Charts, a Checklist

Tableau

Alberto Cairo, data visualization expert and author of How Charts Lie Whether you are reading a social post, news article or business report, it’s important to know and evaluate the source of the data and charts that you view. Ask questions such as: Where did the data come from? How was the data collected?

article thumbnail

Gartner BI & Analytics Summit, Mumbai, 2017: My Take

ElegantJ BI

The 2017 Gartner Summit was the third event I attended and it was impeccably organized and run, with great sound and lighting and informative, exciting presentations. Healthy options are always appreciated and I would encourage the Gartner team to add to the choices for the 2018 Summit.

Insiders

Sign Up for our Newsletter

This site is protected by reCAPTCHA and the Google Privacy Policy and Terms of Service apply.

article thumbnail

Gartner BI & Analytics Summit, Mumbai, 2017: My Take

ElegantJ BI

The 2017 Gartner Summit was the third event I attended and it was impeccably organized and run, with great sound and lighting and informative, exciting presentations. Healthy options are always appreciated and I would encourage the Gartner team to add to the choices for the 2018 Summit.

article thumbnail

11 Best Data Storytelling Courses 2021

Juice Analytics

There are many options for learning, including this list of best data storytelling workshops and absorbing the lessons of masters from 20 amazing data storytelling examples. Story IQ Course: Data Storytelling for Business provides learners with a solid grounding in fundamental data storytelling learning concepts.

article thumbnail

Why do Business Analysts need to learn Data visualization skills?

The BAWorld

But why Data visualization? In this article, I am going to examine Why do Business Analysts need to learn Data visualization skills? This report suggests that, in 2020, the job requirements for data science and analytics is projected to boom to by 364,000 openings to 2,720,000. They need to learn various skills.

article thumbnail

Police Scorecard visualizes data on policing to drive for equity and change

Tableau

The underlying dataset for Police Scorecard is massive: over 13 million cells of data and counting. To provide a way into understanding it, Sinyangwe and his team relied on Tableau data visualizations to highlight key trends in the data. The role of visualization. How to understand Police Scorecard.