Remove 2018 Remove 2023 Remove Data Visualization
article thumbnail

Football Data Visualization Inspiration: 38 Vizzes from the Gridiron

Tableau

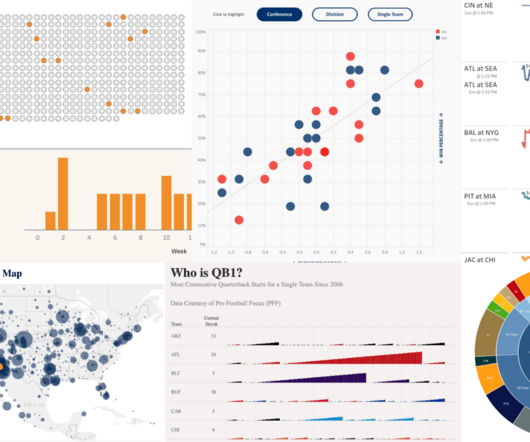
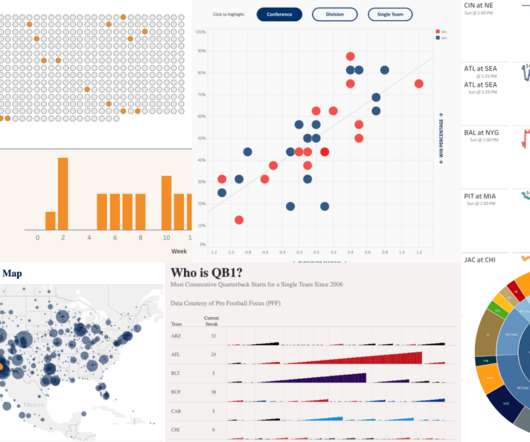
Sarah Molina February 10, 2023 - 8:42pm February 13, 2023 Win-loss margins, receiver routes, fan maps, game predictions—the list goes on for ways the game of American football can be visualized. See the curated collection below showcasing some incredible American football vizzes from the Tableau Community.
Insiders

Sign Up for our Newsletter

This site is protected by reCAPTCHA and the Google Privacy Policy and Terms of Service apply.

article thumbnail

Make Your Data Relatable

Juice Analytics

One thing that Nancy knows is that data communication isn’t just about data visualization — any more than a movie is just about moving images. She makes this point in a recent HBR article The more data we collect, the more mind-boggling these figures become. — Neil deGrasse Tyson (@neiltyson) May 12, 2018.

article thumbnail

How to Spot Misleading Charts, a Checklist

Tableau

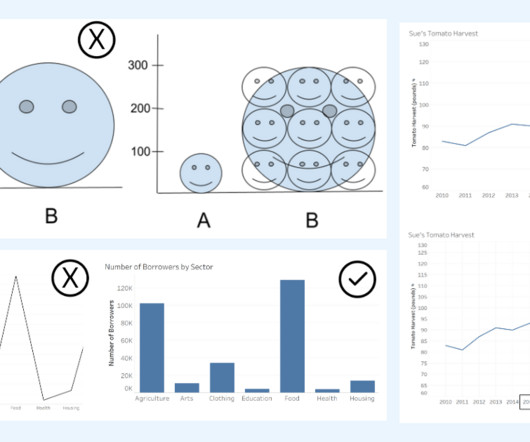
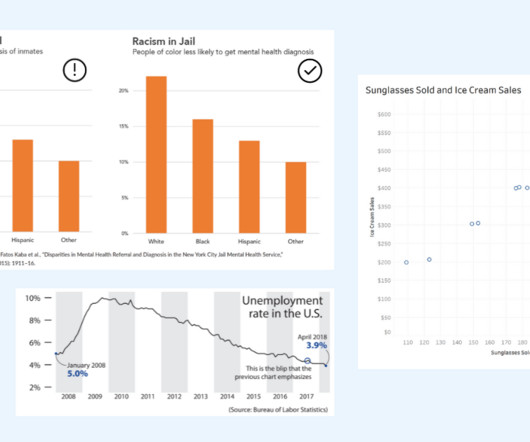
Alyssa Jenson November 14, 2023 - 6:59pm Sue Kraemer Senior Data Skills Curriculum Strategy Manager, Tableau Charts are all around us. In today’s world, the ability to swiftly make decisions and act on data is crucial. Two line graphs showing the same data with different intervals on the axis. Know the Source.

article thumbnail

How To Spot Misleading Charts: Review the Message

Tableau

Ateken Abla November 14, 2023 - 6:59pm Sue Kraemer Senior Data Skills Curriculum Strategy Manager, Tableau Charts exist everywhere. Viewing a chart instead of a table of numbers helps us quickly understand data, see patterns, and make better decisions. In today’s world, swift decision-making with data is crucial.

article thumbnail

Top 10 Analytics And Business Intelligence Trends For 2020

Data Pine

Data exploded and became big. Spreadsheets finally took a backseat to actionable and insightful data visualizations and interactive business dashboards. The rise of self-service analytics democratized the data product chain. BN in 2018, it is also predicted to grow with a CAGR rate of 22.43% by reaching 2024.