This site uses cookies to improve your experience. To help us insure we adhere to various privacy regulations, please select your country/region of residence. If you do not select a country, we will assume you are from the United States. Select your Cookie Settings or view our Privacy Policy and Terms of Use.
Cookie Settings
Cookies and similar technologies are used on this website for proper function of the website, for tracking performance analytics and for marketing purposes. We and some of our third-party providers may use cookie data for various purposes. Please review the cookie settings below and choose your preference.
Used for the proper function of the website
Used for monitoring website traffic and interactions
Cookie Settings
Cookies and similar technologies are used on this website for proper function of the website, for tracking performance analytics and for marketing purposes. We and some of our third-party providers may use cookie data for various purposes. Please review the cookie settings below and choose your preference.
Strictly Necessary: Used for the proper function of the website
Performance/Analytics: Used for monitoring website traffic and interactions
ElegantJ BI , an innovative vendor in Business Intelligence and Augmented Analytics, is pleased to announce that ElegantJ BI is named as Representative Vendors in the Gartner ‘ Market Guide for Traditional Enterprise Reporting Platforms ‘ report published September 28, 2017. Sallam, Nigel Shen.
ElegantJ BI, a leading vendor in Business Intelligence and Advanced Analytics solutions, is pleased to announce that it is listed for its suite in the Gartner ‘Other Vendors to Consider for Modern BI and Analytics’ report published August 4, 2017. Sallam, Cindi Howson, Carlie J. Oestreich, Shubhangi Vashisth.
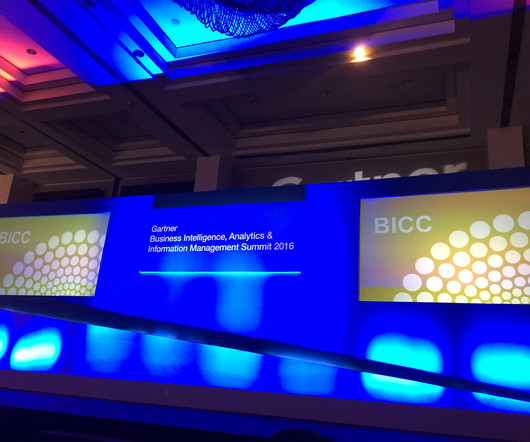
On June 6 and 7, 2017, I had the pleasure of attending and participating in the Gartner Business Intelligence, Analytics and Information Management Summit in Powai, Mumbai, India. The 2017 Summit was larger and even more productive than the Summit of 2016, with more than 650 delegates in attendance.
On June 6 and 7, 2017, I had the pleasure of attending and participating in the Gartner Business Intelligence, Analytics and Information Management Summit in Powai, Mumbai, India. The 2017 Summit was larger and even more productive than the Summit of 2016, with more than 650 delegates in attendance.
On June 6 and 7, 2017, I had the pleasure of attending and participating in the Gartner Business Intelligence, Analytics and Information Management Summit in Powai, Mumbai, India. The 2017 Summit was larger and even more productive than the Summit of 2016, with more than 650 delegates in attendance.
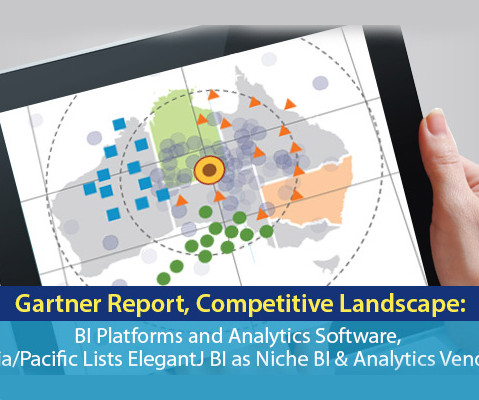
ElegantJ BI , an innovative vendor in Business Intelligence and Augmented Analytics, is pleased to announce that ElegantJ BI is named as Representative Vendors in the Gartner ‘ Market Guide for Traditional Enterprise Reporting Platforms ‘ report published September 28, 2017. Sallam, Nigel Shen.
ElegantJ BI , an innovative vendor in Business Intelligence and Augmented Analytics, is pleased to announce that ElegantJ BI is named as Representative Vendors in the Gartner ‘ Market Guide for Traditional Enterprise Reporting Platforms ‘ report published September 28, 2017. Sallam, Nigel Shen.
ElegantJ BI, a leading vendor in Business Intelligence and Advanced Analytics solutions, is pleased to announce that it is listed for its suite in the Gartner ‘Other Vendors to Consider for Modern BI and Analytics’ report published August 4, 2017. Sallam, Cindi Howson, Carlie J. Oestreich, Shubhangi Vashisth.
ElegantJ BI, a leading vendor in Business Intelligence and Advanced Analytics solutions, is pleased to announce that it is listed for its suite in the Gartner ‘Other Vendors to Consider for Modern BI and Analytics’ report published August 4, 2017. Sallam, Cindi Howson, Carlie J. Oestreich, Shubhangi Vashisth.
Although SageMaker has become a popular hardware accelerator since it was launched in 2017, there are plenty of other overlooked hardware accelerators on the market. A data visualization interface known as SPSS Modeler. Furthermore, there are powerful visualization tools for handling various workflows. Neptune.ai. Neptune.AI
Smart Data Visualization can radically improve your business intelligence, data discovery and analytics. What is Smart Data Visualization? Smart Visualization tools allow users to gather various data components and tell a story. Can Smart Data Visualization Make Business Users Smarter?
Smart Data Visualization can radically improve your business intelligence, data discovery and analytics. What is Smart Data Visualization? Smart Visualization tools allow users to gather various data components and tell a story. Can Smart Data Visualization Make Business Users Smarter?
Smart Data Visualization can radically improve your business intelligence, data discovery and analytics. What is Smart Data Visualization? Smart Visualization tools allow users to gather various data components and tell a story. Can Smart Data Visualization Make Business Users Smarter?
In 2017, 77% of U.S. Some of their solutions include: big data functionality capable of processing national and state-district level statistics, AI algorithms to formulate automatic solutions, combining data analytics tools with data visualization to show hidden and profound insights to business managers. between 2022 and 2030.
Data Visualization : Presenting insights via dashboards or graphs using tools like Tableau or Power BI, enabling decision-makers to act on data effectively. Data Storage : Using scalable technologies like Hadoop or cloud storage to handle vast datasets.
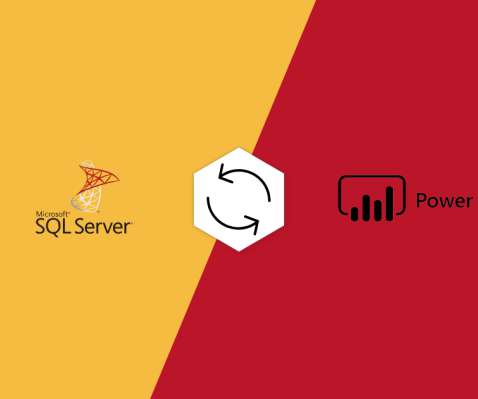
It helps in transforming enterprise data into rich visuals. However, migration from SSRS 2017 has some issues with the PBI RS server. The SSRS configuration manager forgot to run a script that updates the SSRS 2017 ReportServer database so that it can actually work with the Power BI objects. Migrating from SSRS to Power BI.
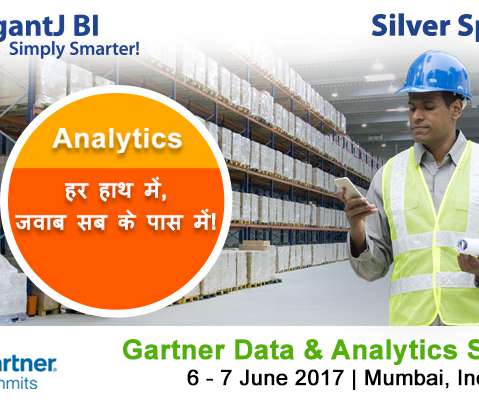
ElegantJ BI is pleased to be a Silver Sponsor at the Gartner Data & Analytics Summit, which will be held on June 6 and 7, 2017 in Mumbai, India. Summit attendees are invited to meet the ElegantJ BI product and solutions team and see demonstrations of the ElegantJ BI solution at the Solution Showcase.
Herald Logic was recently featured in the ’25 Most Promising Retail Solution Providers – 2017′ in Asia Pacific in the annual APAC CIO Outlook Magazine survey. ElegantJ BI takes pride in its partnerships with BFSI organizations.
In our journey forward, ElegantJ BI is currently working to reach an important milestone by adding self-serving data preparation, smart visualization and plug n’ play predictive analytics to have strong offering in ‘Smart Data Discovery’ space. It’s a great moment for team ElegantJ BI and we would like to thank you for your trust and support!
In our journey forward, ElegantJ BI is currently working to reach an important milestone by adding self-serving data preparation, smart visualization and plug n’ play predictive analytics to have strong offering in ‘Smart Data Discovery’ space. It’s a great moment for team ElegantJ BI and we would like to thank you for your trust and support!
In our journey forward, ElegantJ BI is currently working to reach an important milestone by adding self-serving data preparation, smart visualization and plug n’ play predictive analytics to have strong offering in ‘Smart Data Discovery’ space. It’s a great moment for team ElegantJ BI and we would like to thank you for your trust and support!
“By visualizing information, we turn it into a landscape that you can explore with your eyes. 90% of the information transmitted to the brain is visual. Data visualization methods refer to the creation of graphical representations of information. That’s where data visualization comes in. A sort of information map.
The Smarten Advanced Data Discovery gives users the freedom to leverage data beyond simple visual data analysis and dashboards. Smart Data Visualization suggests the best options for visualizing and plotting for a particular set or type of data, based on the nature, dimensions and trend of data.
The Smarten Advanced Data Discovery gives users the freedom to leverage data beyond simple visual data analysis and dashboards. Smart Data Visualization suggests the best options for visualizing and plotting for a particular set or type of data, based on the nature, dimensions and trend of data.
The Smarten Advanced Data Discovery gives users the freedom to leverage data beyond simple visual data analysis and dashboards. Smart Data Visualization suggests the best options for visualizing and plotting for a particular set or type of data, based on the nature, dimensions and trend of data.
For example, you might ask ‘What is the best performing product in all states for 2018 as compared to 2017’ Simple, right? For example, a business user might ask, ‘who sold the most bakery products in 2017 in the Southwest region?’ Ask a simple question, using natural language.
For example, you might ask ‘What is the best performing product in all states for 2018 as compared to 2017’ Simple, right? For example, a business user might ask, ‘who sold the most bakery products in 2017 in the Southwest region?’ Ask a simple question, using natural language.
For example, you might ask ‘What is the best performing product in all states for 2018 as compared to 2017’ Simple, right? For example, a business user might ask, ‘who sold the most bakery products in 2017 in the Southwest region?’ Ask a simple question, using natural language.
It helps in transforming enterprise data into rich visuals. However, migration from SSRS 2017 has some issues with the PBI RS server. The SSRS configuration manager forgot to run a script that updates the SSRS 2017 ReportServer database so that it can actually work with the Power BI objects. MIGRATING FROM SSRS TO POWER BI.
It helps in transforming enterprise data into rich visuals. However, migration from SSRS 2017 has some issues with the PBI RS server. The SSRS configuration manager forgot to run a script that updates the SSRS 2017 ReportServer database so that it can actually work with the Power BI objects. MIGRATING FROM SSRS TO POWER BI.
We had a great response, especially with our Advanced Data Discovery with self serve data prep, smart visualization and plug n’ play predictive analytics. The ElegantJ BI booth was REALLY BUSY. We greeted customers, stakeholders, and partners and provided an update on business. I want to thank those who visited our booth.
We had a great response, especially with our Advanced Data Discovery with self serve data prep, smart visualization and plug n’ play predictive analytics. The ElegantJ BI booth was REALLY BUSY. We greeted customers, stakeholders, and partners and provided an update on business. I want to thank those who visited our booth.
Kurt Schlegel discussed the next big disruption, ‘Self Serve Data Prep from Shadow IT to Citizen Data Science’ Rick Greenwald’s session was concise and to the point, ‘Spark: The Future of Data Analytics’ Unfortunately, Gartner Analyst, Rita Sallam , wasn’t able to attend, but I am anxious to attend her session in 2017!
Our roadmap to the future includes the Smarten approach to self-serve BI tools has garnered very positive feedback from our clients and partners, and we continue to focus on support for business users and the expansion of a self-serve environment with plug n’ play predictive analysis, self-serve data preparation and smart data visualization.”
Our roadmap to the future includes the Smarten approach to self-serve BI tools has garnered very positive feedback from our clients and partners, and we continue to focus on support for business users and the expansion of a self-serve environment with plug n’ play predictive analysis, self-serve data preparation and smart data visualization.”
Our roadmap to the future includes the Smarten approach to self-serve BI tools has garnered very positive feedback from our clients and partners, and we continue to focus on support for business users and the expansion of a self-serve environment with plug n’ play predictive analysis, self-serve data preparation and smart data visualization.”
billion on Google AdWords in 2017 alone. He said that you can use AI to come up with higher quality visuals, create intelligent audience profiles and hold intelligent conversations. Pay per click advertising has changed the forefront of digital marketing forever. Social Media Today reported that advertisers spent $10.1
ElegantJ BI is pleased to be a Silver Sponsor at the Gartner Data & Analytics Summit, which will be held on June 6 and 7, 2017 in Mumbai, India. Summit attendees are invited to meet the ElegantJ BI product and solutions team and see demonstrations of the ElegantJ BI solution at the Solution Showcase.
ElegantJ BI is pleased to be a Silver Sponsor at the Gartner Data & Analytics Summit, which will be held on June 6 and 7, 2017 in Mumbai, India. Summit attendees are invited to meet the ElegantJ BI product and solutions team and see demonstrations of the ElegantJ BI solution at the Solution Showcase.
ElegantJ BI has a strong product roadmap that encompasses ‘ Advanced Data Discovery ‘ that puts self-serve data preparation, smart visualization and Plug n’ Play predictive analytics in the hands of business users and transforms them into Citizen Data Scientists.
For example, a business user might ask, ‘who sold the most bakery products in 2017 in the Southwest region?’ Let’s take it one step further with Clickless Analytics.
For example, a business user might ask, ‘who sold the most bakery products in 2017 in the Southwest region?’ Let’s take it one step further with Clickless Analytics.
For example, a business user might ask, ‘who sold the most bakery products in 2017 in the Southwest region?’ Let’s take it one step further with Clickless Analytics.
The ElegantJ BI Advanced Data Discovery, Smarten approach to BI tools, includes Plug n’ Play Predictive Analysis, Self-Serve Data Preparation and Smart Data Visualization. Read more: ElegantJ BI Business Intelligence Included in Gartner Nov.,
We organize all of the trending information in your field so you don't have to. Join 57,000+ users and stay up to date on the latest articles your peers are reading.
You know about us, now we want to get to know you!
Let's personalize your content
Let's get even more personalized
We recognize your account from another site in our network, please click 'Send Email' below to continue with verifying your account and setting a password.


Let's personalize your content