This site uses cookies to improve your experience. To help us insure we adhere to various privacy regulations, please select your country/region of residence. If you do not select a country, we will assume you are from the United States. Select your Cookie Settings or view our Privacy Policy and Terms of Use.
Cookie Settings
Cookies and similar technologies are used on this website for proper function of the website, for tracking performance analytics and for marketing purposes. We and some of our third-party providers may use cookie data for various purposes. Please review the cookie settings below and choose your preference.
Used for the proper function of the website
Used for monitoring website traffic and interactions
Cookie Settings
Cookies and similar technologies are used on this website for proper function of the website, for tracking performance analytics and for marketing purposes. We and some of our third-party providers may use cookie data for various purposes. Please review the cookie settings below and choose your preference.
Strictly Necessary: Used for the proper function of the website
Performance/Analytics: Used for monitoring website traffic and interactions
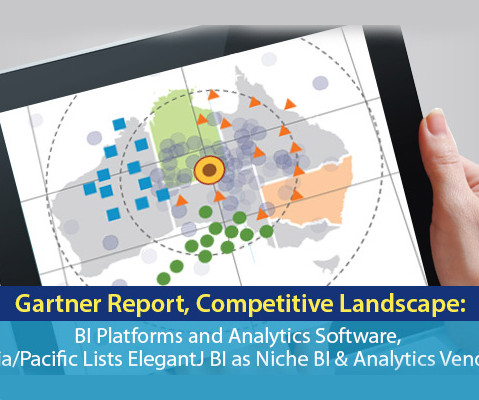
ElegantJ BI, a leading vendor in Business Intelligence and Advanced Analytics solutions, is pleased to announce that it is listed for its suite in the Gartner ‘Other Vendors to Consider for Modern BI and Analytics’ report published August 4, 2017. Sallam, Cindi Howson, Carlie J. Oestreich, Shubhangi Vashisth.
On June 6 and 7, 2017, I had the pleasure of attending and participating in the Gartner Business Intelligence, Analytics and Information Management Summit in Powai, Mumbai, India. The 2017 Summit was larger and even more productive than the Summit of 2016, with more than 650 delegates in attendance.
On June 6 and 7, 2017, I had the pleasure of attending and participating in the Gartner Business Intelligence, Analytics and Information Management Summit in Powai, Mumbai, India. The 2017 Summit was larger and even more productive than the Summit of 2016, with more than 650 delegates in attendance.
On June 6 and 7, 2017, I had the pleasure of attending and participating in the Gartner Business Intelligence, Analytics and Information Management Summit in Powai, Mumbai, India. The 2017 Summit was larger and even more productive than the Summit of 2016, with more than 650 delegates in attendance.
ElegantJ BI, a leading vendor in Business Intelligence and Advanced Analytics solutions, is pleased to announce that it is listed for its suite in the Gartner ‘Other Vendors to Consider for Modern BI and Analytics’ report published August 4, 2017. Sallam, Cindi Howson, Carlie J. Oestreich, Shubhangi Vashisth.
ElegantJ BI, a leading vendor in Business Intelligence and Advanced Analytics solutions, is pleased to announce that it is listed for its suite in the Gartner ‘Other Vendors to Consider for Modern BI and Analytics’ report published August 4, 2017. Sallam, Cindi Howson, Carlie J. Oestreich, Shubhangi Vashisth.
Herald Logic was recently featured in the ’25 Most Promising Retail Solution Providers – 2017′ in Asia Pacific in the annual APAC CIO Outlook Magazine survey. ElegantJ BI takes pride in its partnerships with BFSI organizations. .”
Our team takes an innovative approach to Business Intelligence with focused support for business users and the expansion of a self-serve environment.” ” ElegantJ BI offers complete Business Intelligence and performance capabilities in one integrated technology solution.
Herald Logic was recently featured in the ’25 Most Promising Retail Solution Providers – 2017′ in Asia Pacific in the annual APAC CIO Outlook Magazine survey. ElegantJ BI takes pride in its partnerships with BFSI organizations. .”
Herald Logic was recently featured in the ’25 Most Promising Retail Solution Providers – 2017′ in Asia Pacific in the annual APAC CIO Outlook Magazine survey. ElegantJ BI takes pride in its partnerships with BFSI organizations. .”
Our team takes an innovative approach to Business Intelligence with focused support for business users and the expansion of a self-serve environment.” ” ElegantJ BI offers complete Business Intelligence and performance capabilities in one integrated technology solution.
Our team takes an innovative approach to Business Intelligence with focused support for business users and the expansion of a self-serve environment.” ” ElegantJ BI offers complete Business Intelligence and performance capabilities in one integrated technology solution.
They shine a spotlight on new voices, innovative ideas, and make the communities around them better. Being a Tableau Ambassador allows me to help others learn Tableau and empower them with analytics and data visualization skills. for her freelance clients and in her full-time role as a Data Visualization Engineer at Cart.com.
History and innovations in recent times. Cloud technology and innovation drives data-driven decision making culture in any organization. It is the epitome of modern technology right now with multi-dimensional innovations shaping every layer. The pandemic gave it the push it needed to accelerate in terms of growth and innovation.
Exciting and futuristic, the concept of computer vision is based on computing devices or programs gaining the ability to extract detailed information from visual images. Visual analytics: Around three million images are uploaded to social media every single day. billion in 2017 to $190.61 Artificial Intelligence (AI).
In terms of visual design, we’ve already polished the popular apps to the moon and back! Maybe too much, if you remember the Skype and Dropbox redesigns in 2017. “UI to inform and disclose” Per Axbom, Designer, Writer and Coach, Axbom Innovation. Browsing a well-crafted interface is like reading a great story.
Our innovations are people-centric by design, helping unlock creativity to solve tangible challenges with data. Tableau lets you visualize and explore all of your data without having to write code or premeditate your vizzes and dashboards. People love Tableau because it’s powerful, yet intuitive.
While developers are often provided with program or project management support, it’s often up to each developer to effectively manage their deadlines against tight requests — from managers who want more innovative products and customers with unique needs to solve challenging use cases. Overcoming workplace time-sucks.
You can represent the vision in a variety of ways including as a tagline, meme, a product differentiation statement [3], a visual image, or a storyline. Is there a visual image? The bottom row of Product Canvas Part 1 is about the product competitive and innovation situation. Canvas Vision tips: What do we strive to be?
Data is the New Oil” was coined by The Economist in May 2017 and became a mantra for organizations to drive new wealth from data. Data teams can look forward to more innovative tools that will enable them to drive value from raw data in their cloud data warehouses. But in reality, data by itself has no value. Use AI to drive ROI.
With these new features analysts now have the industry’s first end-to-end platform for data connection, preparation, discovery, visualization, collaboration and optimization. With Analyzer, analysts will have one workspace from which they can choose and explore all data sets and simultaneously display data tables alongside visualizations.
Bringing the Narrative Science award-winning, world-leading AI in analytics team and their innovations to Tableau will help us reach millions more people who are underserved with data," said Tableau President and CEO Mark Nelson. Put analytics in the flow of work.
Bringing the Narrative Science award-winning, world-leading AI in analytics team and their innovations to Tableau will help us reach millions more people who are underserved with data," said Tableau President and CEO Mark Nelson. Put analytics in the flow of work.
While these industries are traditionally slow in adopting new innovations, there are some front-runners that are leading the pack. In 2017 the company wanted to take its shopping experience one step further by creating an augmented reality app that allowed users to test a product without having to leave their homes. 8) The MagicBand.
Innovators have already changed how we all view transportation in the past decade, including the shift from gasoline to battery-electric and from car ownership to transportation-as-a-service. As an OEM, why give up such an important visual element of your interior to a supplier? The second problem is much, much bigger.
Note that extended support for Oracle Discoverer ended in 2017. Interactive dashboards that provide reports with a rich variety of visualization tools. Spatial intelligence that allows users to visualize analytics via map-based visualizations. Oracle’s 2014 Statement of Direction laid out its support strategy.
They shine a spotlight on new voices, innovative ideas, and make the communities around them better. Being a Tableau Ambassador allows me to help others learn Tableau and empower them with analytics and data visualization skills. for her freelance clients and in her full-time role as a Data Visualization Engineer at Cart.com.
They shine a spotlight on new voices, innovative ideas, and make the communities around them better. Being a Tableau Ambassador allows me to help others learn Tableau and empower them with analytics and data visualization skills. for her freelance clients and in her full-time role as a Data Visualization Engineer at Cart.com.
Brand Forum The 3rd annual Brand Forum in Sydney saw approximately 300 CMOs and senior brand marketing executives across all sectors come together to explore the latest trends, tactics, and innovations in brand marketing. There’s no better way to do it than to join us for Domopalooza 2017 , March 21-24 in Salt Lake City, UT.
And when understood and used in innovative ways, they can drastically improve the way you see and use the data you have on hand and the way you analyze it. Gartner named machine learning its top strategic tech trend for 2017. Ovum calls it the “biggest disruptor for big data analytics in 2017.”
The current VUCA climate (volatility, uncertainty, complexity, ambiguity) has forced organizations to rethink their management methods, to plan in the short term, to better visualize the outcome of their work, and to validate the value of their outcomes. software product development, marketing, innovation, etc.), The Present.
Our innovations are people-centric by design, helping unlock creativity to solve tangible challenges with data. Tableau lets you visualize and explore all of your data without having to write code or premeditate your vizzes and dashboards. People love Tableau because it’s powerful, yet intuitive.
The current VUCA climate (volatility, uncertainty, complexity, ambiguity) has forced organizations to rethink their management methods, to plan in the short term, to better visualize the outcome of their work, and to validate the value of their outcomes. software product development, marketing, innovation, etc.), The Present.
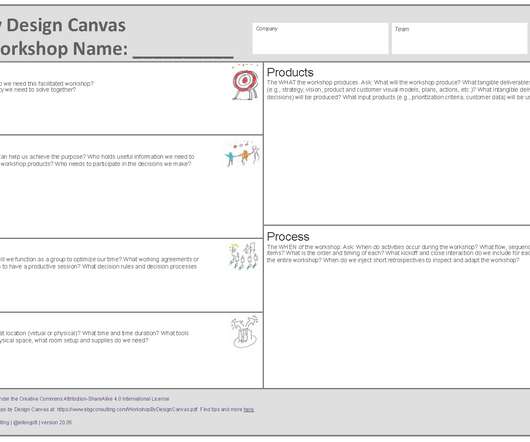
Use visual tools that ignite diverse views and encourage creative thinking. The Workshop by Design Canvas is a visual tool for using the Six Ps. Represent workshop products using visual models, images, and shapes to increase learning, spark innovation, and improve retention. Wiley and Sons, October 2017.
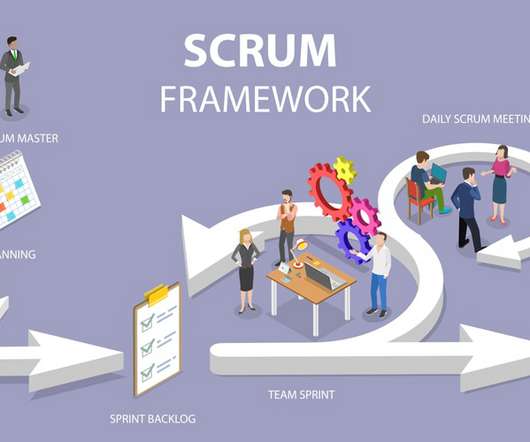
Lack of Innovation . Scaling agile enables transparency across the organization by connecting and visualizing the work by every team member. Scaling agile allows them to visualize how ARTs or teams of teams measure their progress and performance, deliver their products, and gauge the financial impact of their work. . 5.
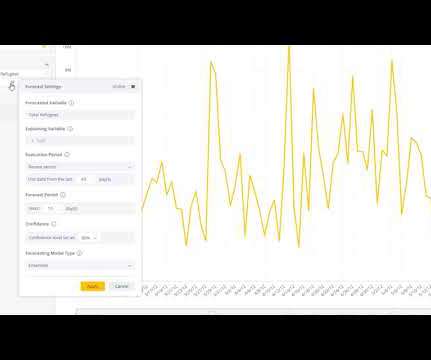
Innovation is necessary to use data effectively in the pursuit of a better world, particularly because data continues to increase in size and richness. I am proud to announce that my History of Tableau Innovation viz is now published to Tableau Public. Click to view the full interactive visualization. December 1, 2021 - 11:06pm.
ElegantJ BI , an innovative vendor in Business Intelligence and Augmented Analytics, is pleased to announce that ElegantJ BI is named as Representative Vendors in the Gartner ‘ Market Guide for Traditional Enterprise Reporting Platforms ‘ report published September 28, 2017. Sallam, Nigel Shen.
ElegantJ BI , an innovative vendor in Business Intelligence and Augmented Analytics, is pleased to announce that ElegantJ BI is named as Representative Vendors in the Gartner ‘ Market Guide for Traditional Enterprise Reporting Platforms ‘ report published September 28, 2017. Sallam, Nigel Shen.
Our roadmap to the future includes the Smarten approach to self-serve BI tools has garnered very positive feedback from our clients and partners, and we continue to focus on support for business users and the expansion of a self-serve environment with plug n’ play predictive analysis, self-serve data preparation and smart data visualization.”
Our roadmap to the future includes the Smarten approach to self-serve BI tools has garnered very positive feedback from our clients and partners, and we continue to focus on support for business users and the expansion of a self-serve environment with plug n’ play predictive analysis, self-serve data preparation and smart data visualization.”
Our roadmap to the future includes the Smarten approach to self-serve BI tools has garnered very positive feedback from our clients and partners, and we continue to focus on support for business users and the expansion of a self-serve environment with plug n’ play predictive analysis, self-serve data preparation and smart data visualization.”
We recognize the important innovations and evolution of this market and we look forward to our continued involvement in this exciting market.” “The ElegantJ BI team has established a product and service roadmap that will advance innovation and serve business users and organizations in all kinds of organizations,” Patel says.
We organize all of the trending information in your field so you don't have to. Join 57,000+ users and stay up to date on the latest articles your peers are reading.
You know about us, now we want to get to know you!
Let's personalize your content
Let's get even more personalized
We recognize your account from another site in our network, please click 'Send Email' below to continue with verifying your account and setting a password.


Let's personalize your content