Remove 2017 Remove Digital Transformation Remove Visualization
article thumbnail

Gartner BI & Analytics Summit, Mumbai, 2017: My Take

ElegantJ BI

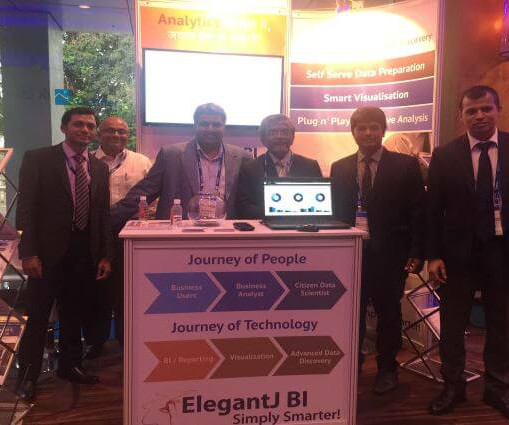
On June 6 and 7, 2017, I had the pleasure of attending and participating in the Gartner Business Intelligence, Analytics and Information Management Summit in Powai, Mumbai, India. The 2017 Summit was larger and even more productive than the Summit of 2016, with more than 650 delegates in attendance.
Insiders

Sign Up for our Newsletter

This site is protected by reCAPTCHA and the Google Privacy Policy and Terms of Service apply.

article thumbnail

Gartner BI & Analytics Summit, Mumbai, 2017: My Take

ElegantJ BI

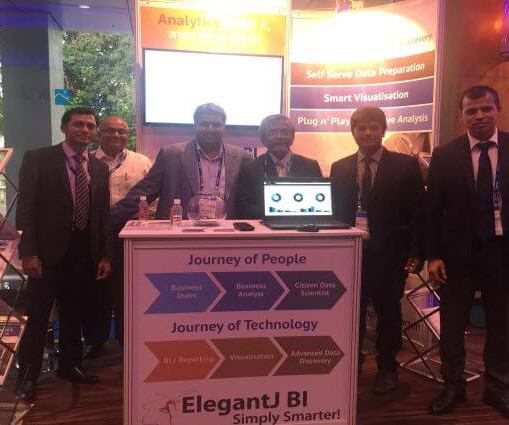
On June 6 and 7, 2017, I had the pleasure of attending and participating in the Gartner Business Intelligence, Analytics and Information Management Summit in Powai, Mumbai, India. The 2017 Summit was larger and even more productive than the Summit of 2016, with more than 650 delegates in attendance.
article thumbnail

Unleash the Power of Advanced Analytics with the Sisense Q4 2019 Release

Sisense

Data is the New Oil” was coined by The Economist in May 2017 and became a mantra for organizations to drive new wealth from data. The first wave of digital transformations saw a dramatic decrease in data storage costs. But in reality, data by itself has no value. On-demand compute resources and MPP cloud data warehouses emerged.

article thumbnail

Tableau: 9 years a Leader in Gartner Magic Quadrant for Analytics and Business Intelligence Platforms

Tableau

Tableau lets you visualize and explore all of your data without having to write code or premeditate your vizzes and dashboards. We also reached some incredible milestones with Tableau Prep, our easy-to-use, visual, self-service data prep product. With data at its core, the Customer 360 is a key enabler for digital transformation.

article thumbnail

Natural Language Processing Supports Business User Analytics!

ElegantJ BI

They can enter a search query like, ‘who sold the most polo shirts in IL in May of 2017’, and the system will translate the query, and return the results in natural language in an appropriate form, such as visualization, tables, numbers or descriptions.