Remove 2017 Remove Data Visualization Remove Digital
article thumbnail

Gartner BI & Analytics Summit, Mumbai, 2017: My Take

ElegantJ BI

On June 6 and 7, 2017, I had the pleasure of attending and participating in the Gartner Business Intelligence, Analytics and Information Management Summit in Powai, Mumbai, India. The 2017 Summit was larger and even more productive than the Summit of 2016, with more than 650 delegates in attendance.


Insiders

Sign Up for our Newsletter

This site is protected by reCAPTCHA and the Google Privacy Policy and Terms of Service apply.

article thumbnail

Gartner BI & Analytics Summit, Mumbai, 2017: My Take

ElegantJ BI

On June 6 and 7, 2017, I had the pleasure of attending and participating in the Gartner Business Intelligence, Analytics and Information Management Summit in Powai, Mumbai, India. The 2017 Summit was larger and even more productive than the Summit of 2016, with more than 650 delegates in attendance.

article thumbnail

13 Essential Data Visualization Techniques, Concepts & Methods To Improve Your Business – Fast

Data Pine

Concerning professional growth, development, and evolution, using data-driven insights to formulate actionable strategies and implement valuable initiatives is essential. Data visualization methods refer to the creation of graphical representations of information. That’s where data visualization comes in.

article thumbnail

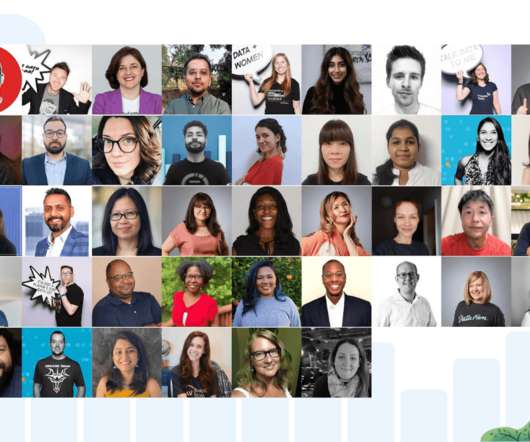
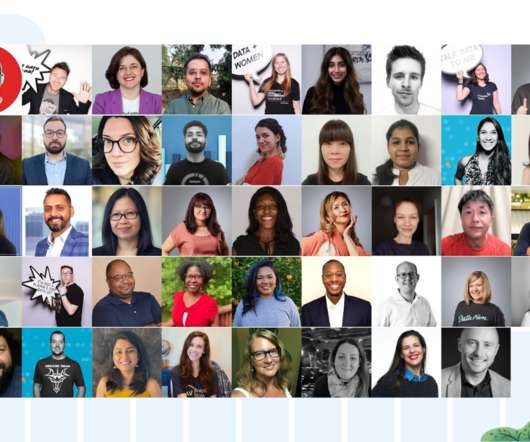
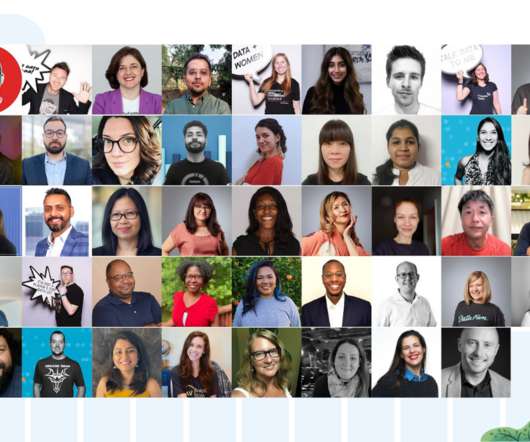
Who are the Tableau Social Ambassadors?

Tableau

Social Ambassadors are inclusive leaders who create and share engaging content in social, digital, and in-person experiences. They go above and beyond to drive thought-provoking conversations about data across all social channels. for her freelance clients and in her full-time role as a Data Visualization Engineer at Cart.com.

article thumbnail

Top 10 IT & Technology Buzzwords You Won’t Be Able To Avoid In 2020

Data Pine

billion in 2017 to $190.61 Gartner has stated that “artificial intelligence in the form of automated things and augmented intelligence is being used together with IoT, edge computing and digital twins.” The research firm Markets and Markets , for instance, estimates that the AI market will grow from $16.06 billion by 2025.

article thumbnail

Tableau: 9 years a Leader in Gartner Magic Quadrant for Analytics and Business Intelligence Platforms

Tableau

With data at its core, the Customer 360 is a key enabler for digital transformation. Together with MuleSoft and Datorama, Tableau can connect to and bring together even more data, providing a complete view of your business and its data to help you find opportunities and deepen customer relationships.