Remove 2017 Remove Book Remove Visualization
article thumbnail

How to Spot Misleading Charts, a Checklist

Tableau

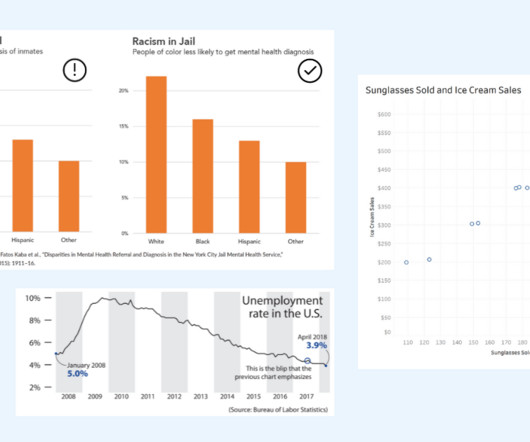
Alberto Cairo, data visualization expert and author of How Charts Lie Whether you are reading a social post, news article or business report, it’s important to know and evaluate the source of the data and charts that you view. The graph on the left is missing 2016, 2017 and 2018. Checklist, your guide to reviewing charts Source.

article thumbnail

20 expert opinions on UI design trends for 2018

Userzoom

In terms of visual design, we’ve already polished the popular apps to the moon and back! Maybe too much, if you remember the Skype and Dropbox redesigns in 2017. 2017 was the year where ideas from apps began to influence the design of ‘normal’ websites. Browsing a well-crafted interface is like reading a great story.

Insiders

Sign Up for our Newsletter

This site is protected by reCAPTCHA and the Google Privacy Policy and Terms of Service apply.

article thumbnail

Using the Product Canvas to Define Your Product’s Core Requirements

EBG Consulting

A unique color and image is used to visually identify each dimension. Download them from the visual language section of the Discover to Deliver resources site. Use visual models where possible to enhance and enliven conversations in Product Canvas and product discovery workshops. Source: EBG Consulting, Inc.

article thumbnail

Create Modern SQL Dashboards With Professional Tools & Software

Data Pine

In some cases, you will need a coding solution where you can build your own queries, but in others, you will also look for a visual representation of your realational data. How To Create SQL Dashboards – Coding & Visuals. The good news is that you can utilize both with the help of a modern and professional SQL dashboard.

article thumbnail

Top 10 IT & Technology Buzzwords You Won’t Be Able To Avoid In 2020

Data Pine

Exciting and futuristic, the concept of computer vision is based on computing devices or programs gaining the ability to extract detailed information from visual images. Visual analytics: Around three million images are uploaded to social media every single day. billion in 2017 to $190.61 Artificial Intelligence (AI).

article thumbnail

How To Spot Misleading Charts: Review the Message

Tableau

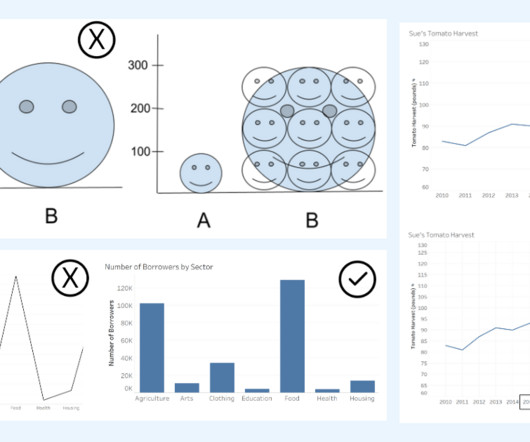
Data Visualization expert and author Kathy Rowell says that we should always ask “Compared to What?” For example, in How Charts Lie: Getting Smarter about Visual Information , Alberto Cairo discusses the following bar chart. Bar graph showing unemployment increasing from July to August of 2017.

article thumbnail

The “Big Tech” Threat to Automotive OEMs and Their Suppliers

Leading Agile

As an OEM, why give up such an important visual element of your interior to a supplier? And secondly, the infotainment console is something that I look at more than almost any other feature of the vehicle, other than the front windshield and gauges. I’d like that item to look good and remind me of what a great purchase I made with this car.

Digital 118