Remove 2016 Remove Data Visualization Remove Finance
article thumbnail

The Top 20 Data Visualization Books That Should Be On Your Bookshelf

Data Pine

Now that you’re sold on the power of data analytics in addition to data-driven BI, it’s time to take your journey a step further by exploring how to effectively communicate vital metrics and insights in a concise, inspiring, and accessible format through the power of visualization. Data visualization: What You Need To Know.

article thumbnail

13 Essential Data Visualization Techniques, Concepts & Methods To Improve Your Business – Fast

Data Pine

Digital data not only provides astute insights into critical elements of your business but if presented in an inspiring, digestible, and logical format, it can tell a tale that everyone within the organization can get behind. Data visualization methods refer to the creation of graphical representations of information.

Insiders

Sign Up for our Newsletter

This site is protected by reCAPTCHA and the Google Privacy Policy and Terms of Service apply.

article thumbnail

insightsoftware Acquires Vizlib, Extending Write-Back to Qlik Users

Insight Software

It also complements insightsoftware’s previous acquisition of Power ON , and extends write-back : the ability to update source data in enterprise databases directly onto the Qlik platform. The rate at which the world’s finance, operations, and business leaders must analyze complex, robust data continues to increase at a rapid pace.

article thumbnail

Police Scorecard visualizes data on policing to drive for equity and change

Tableau

The underlying dataset for Police Scorecard is massive: over 13 million cells of data and counting. To provide a way into understanding it, Sinyangwe and his team relied on Tableau data visualizations to highlight key trends in the data. According to the Scorecard data, arrests have steadily declined since then. “We

article thumbnail

Customer Story: Stance

Domo

“The first impression was beautiful,” said Brian Shea, Stance’s VP of Finance. Attendees at Domopalooza 2016 got to hear it straight from the source. “The colors, the aspect of it, the ease of manipulating it… If I could sum it up in one word, it would be: magical.”

article thumbnail

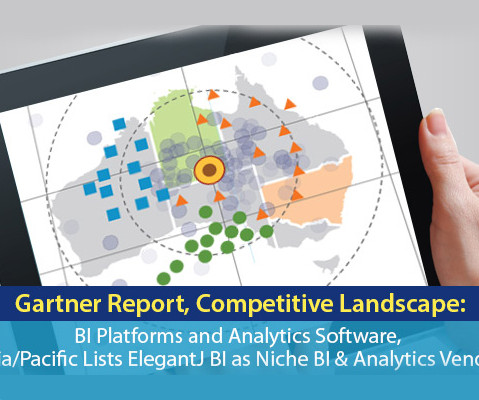
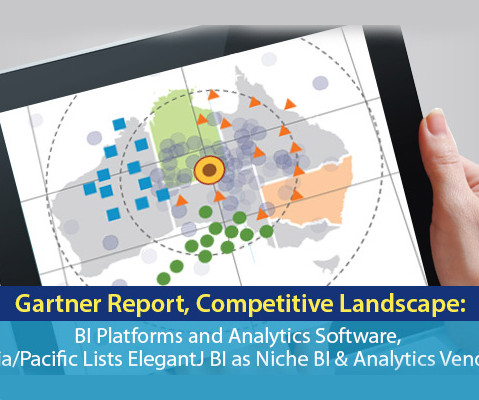
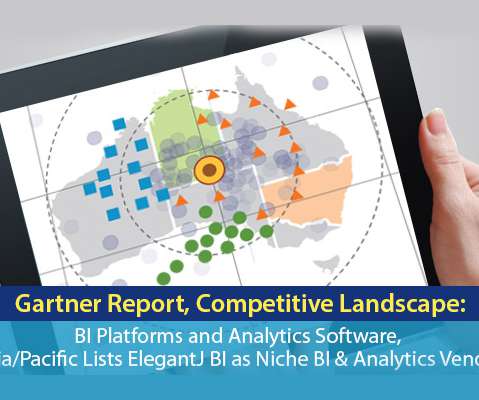
Gartner Report, Competitive Landscape: BI Platforms and Analytics Software, Asia/Pacific Lists ElegantJ BI as Niche BI & Analytics Vendor

ElegantJ BI

ElegantJ BI, a leader in Business Intelligence solutions, is pleased to announce that its suite of Business Intelligence and Performance Management tools was listed in the Gartner August, 2016 Competitive Landscape: BI Platforms and Analytics Software, Asia/Pacific Report. Sallam ] Josh Parenteau ] Cindi Howson ] Kurt Schlegel ] Thomas W.